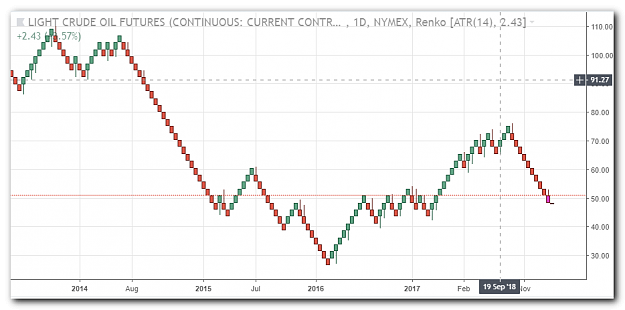
Expect prices to go lower. Inventories might push it further downhill or cause a temporary bounce.
Oversupply is the main reason for these drops i personally think the oil scale industrie will suffer from these low prices which ultimately impacts supply and demand (balancing supply and demand)
persistence and determination alone are omnipotent
Saudi Oil Min. Al-Falih: Current oil price is not linked to fundamentals
Saudi oil minister Khalid Al-Falih was out with some comments in the last hour, saying that the current oil price is not linked to fundamentals and what happened to oil market was political, macroeconomic and speculative trading. Additional quotes:
• Says that inventories are drawing down by the end of Q1 2019.
• Says all OPEC countries are committed to cuts of 3%.
• Says that non-OPEC have committed to cuts of 2%, including Russia.
• Says that there is a lot of speculative money affecting energy prices.
• Says will achieve a balance between supply and demand next year.
• Says that OPEC+ decision is very balanced, measured and very strong.
• Inventories have already started to go down in the last few weeks.
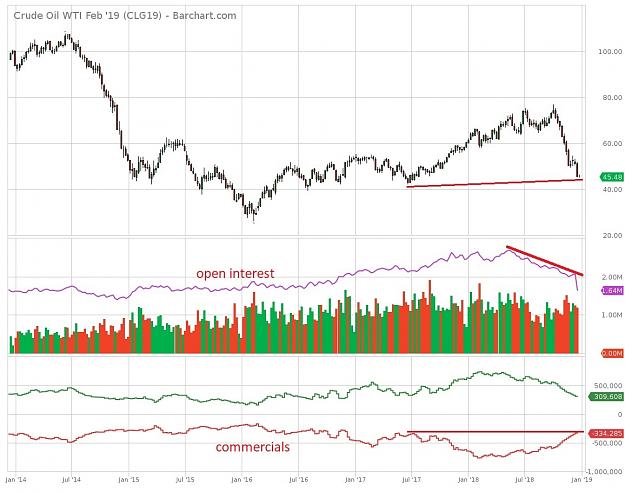
WTI's indicator divergences should be a warning to bulls, 61.8% fibo under pressure
20 December 2018, 19:25
WTI continues in its decline, printing fresh lows with eyes on a full retracement of the summer 2017 lows on the $42 handle.
Oil futures continue to bleed following Wednesday's FOMC announcements while investor's continue to fret oversupply and demand issues.
Indicator divergence, along with fibo support is a warning to bears.
The path of least resistance is lower for oil and yesterday's semi dovish hike has left the door open for at least two interest rate hikes in 2019 instead of potentially none at all, of which the street was positioning for. However, the toxic cocktail of downside revisions to GDP 2018/19 as well as continued rate hikes is a hard pill to swallow for the oil market. On the flip side
On the other hand, it appears that Saudi Arabi is looking to reduce its output by about 322,000 barrels a day from October, instead of the 250,000 barrels a day announced at the OPEC meeting earlier this month, according to the WSJ. Additionally, the Energy Information Administration reported Wednesday that domestic crude supplies fell by 500,000 barrels for the week ending Dec. 14. However, that was less than the decline than the 3 million barrel-fall expected by an S&P Global Platts survey of analysts. WTI levels
The price is on the verge of breaching the 2016 uptrend's 61.8% fibo located at $45.45. RSI is now oversold on the weekly charts, although that is not to say the price cannot fall further before a correction might be due. However, there is some slight bullish divergence on the daily RSI to price action and more so on the 4hr outlook which could result in a bid in oil at this juncture before S2 at 45.45. MACD is also looking to turn up. On the flipside, bulls need to get back above 51.30, as the 50% level of the same range.
KUWAIT (Reuters) - If the agreed 1.2 million-barrel cut in oil production is not enough, OPEC and non-OPEC producers will hold an extraordinary meeting and do what is necessary to balance the market, the United Arab Emirate's energy minister said on Sunday.
persistence and determination alone are omnipotent
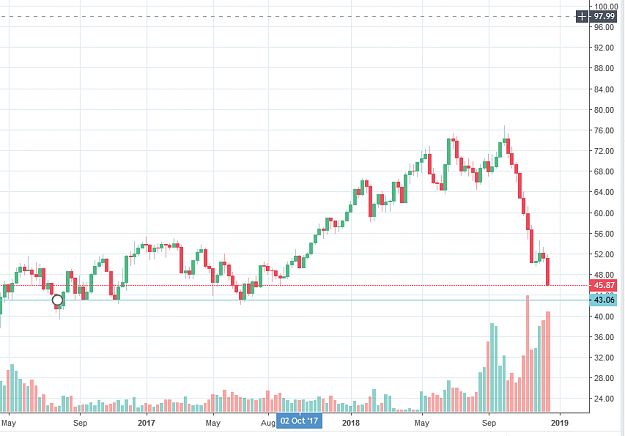
WTI TUMBLES 4% TO FRESH 17-MONTH LOWS
24 December 2018, 20:54
Crude oil resumes and tumbles on Christmas eve session.
Wall Street also extends losses, Dow Jones down 15% so far in December.
WTI (oil futures on NYMEX) continued to slide on Monday, accelerating to the downside on US hours. The barrel bottomed at $42.65, the lowest since June 2017. It was about to end the session with a clear bearish tone under pressure and posting a loss of 4%. Crude oil continues to be unable to find support. From the October peak has fallen 45%.
Liquidity conditions were thin during Monday’s trade and could have contributed to the magnitude of the decline. However, the trend still points to the downside, and no signals of a potential correction are seen, other than extreme oversold readings.
Equity prices during the Christmas Eve session (Wall Street won’t open on Tuesday) dropped sharply in the US with stock indices hitting fresh 1-year lows. December’s performance so far is the worst in years. The Dow Jones lost almost 3% as the negative tone continues amid uncertainties about the global economic outlook for next year, and also on the back of US political dynamics. Today US President Trump criticized hardly the Federal Reserve and Democrats.
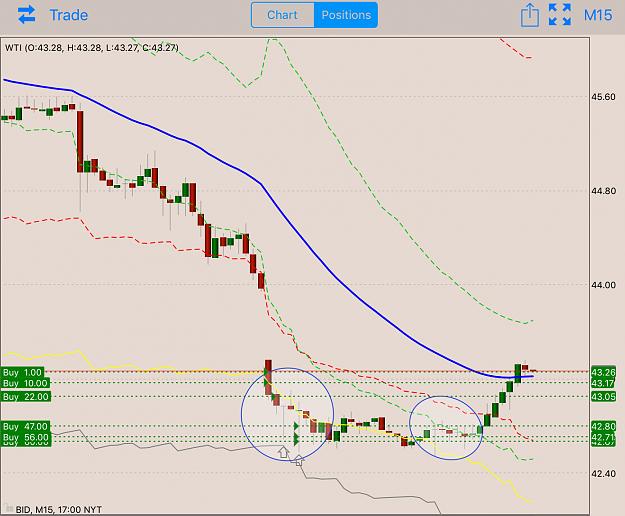
As i said in previous post this dip is very good opportunity to build long position, i start buying from 43.26 all way down to 42.50. Adding heavily on drop in to first hammer on 15 minutes.
As i said in previous post this dip is very good opportunity to build long position, i start buying from 43.26 all way down to 42.50. Adding heavily on drop in to first hammer on 15 minutes. {image}
Ignored
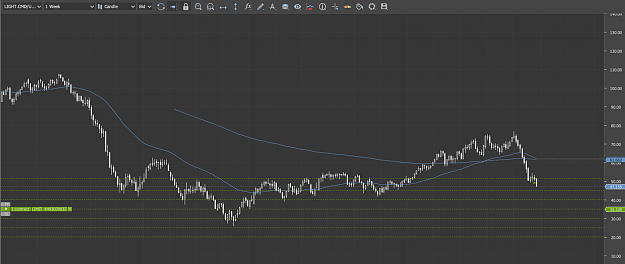
Hope it pays out Mike7. It seems the support (weekly chart) is doing it's work followed by equity futures.
persistence and determination alone are omnipotent
{quote} Hope it pays out Mike7. It seems the support (weekly chart) is doing it's work followed by equity futures.
Ignored
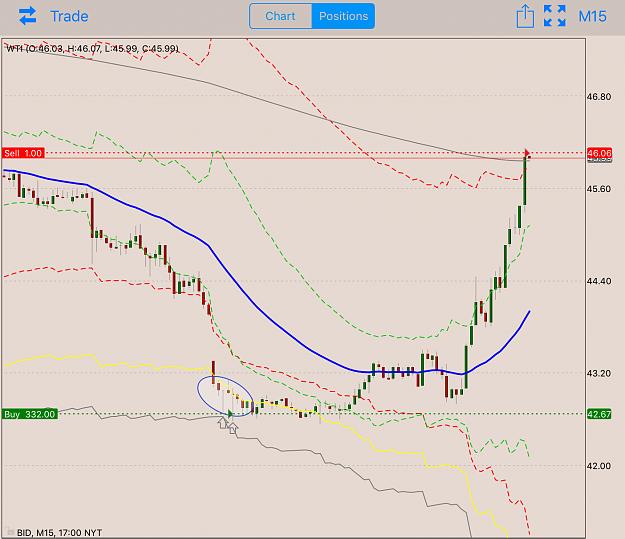
Oil went to far from 20ma. I am using trend risk band to gage the move.
when it goes beyond yellow i always start building counter position.
Just closed last long and open short
EIA: Commercial crude oil inventories stayed virtually unchanged in week ending Dec. 21
28 December 2018, 18:05
Below are some key highlights from the weekly report published by the U.S. Energy Information Administration.
U.S. crude oil refinery inputs averaged 17.4 million barrels per day during the week ending December 21, 2018, which was 58,000 barrels per day less than the previous week’s average.
Gasoline production decreased last week, averaging 10.1 million barrels per day.
Distillate fuel production increased last week, averaging 5.4 million barrels per day
U.S. crude oil imports averaged 7.7 million barrels per day last week, up by 233,000 barrels per day from the previous week.
U.S. commercial crude oil inventories remained virtually unchanged from the previous week.
Total products supplied over the last four-week period averaged 21.3 million barrels per day, up by 3.4% from the same period last year.
persistence and determination alone are omnipotent
As I shared with members of my channel,
Im still going to try to swing the oil till 75. Saudis need it to be at least 80 to cover their budget and current prices are an amazing opportunity to profit off of oil since unlike any other commodity, oil is practically running some countries like Saudi Arabia and my homeland Iran. so the price of it cant fall more than a certain amount (historically have never been under 17 and in this day and age, I cant possibly see it going down more than 21 and reaching that level is very unlikely as it is too) so assuming that most buyers are still waiting to buy at 36, its a good idea to slowly build a bullish position on oil by longing it in very small parts and adding to it on each price milestone if it goes further down.
in a couple of months (winter effect and new year portfolios getting built again) it can definitely make you some easy money.. you just need to manage your positions properly according to the size of your account and not get greedy and over leverage on trades.