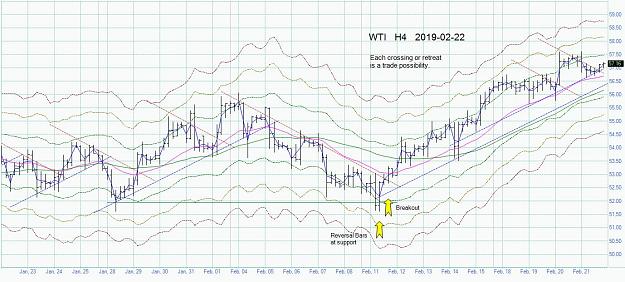
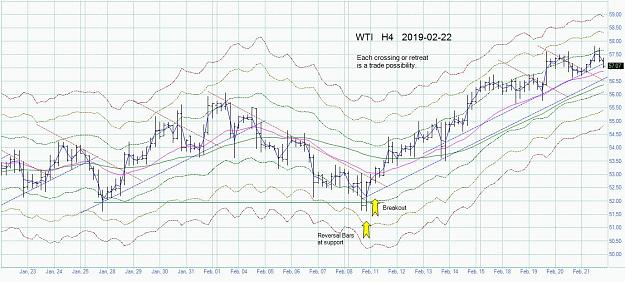
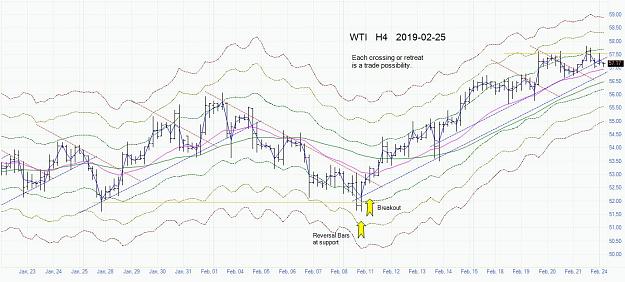
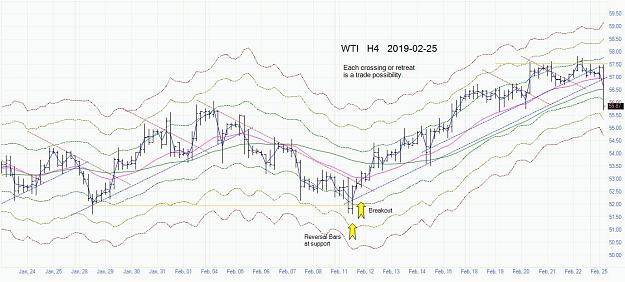
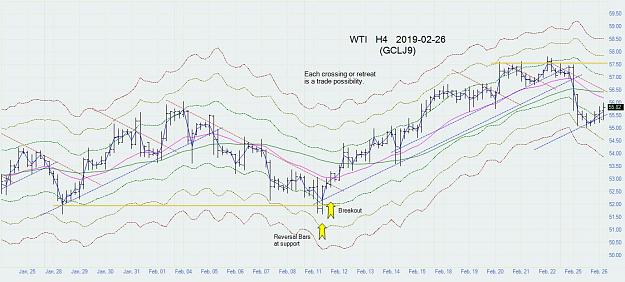
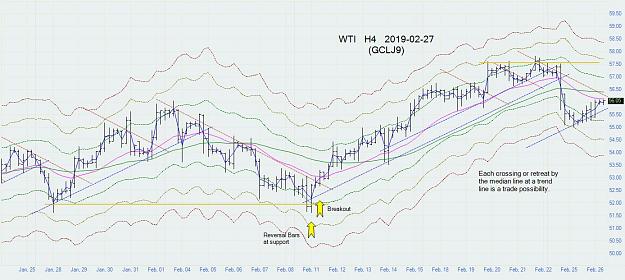
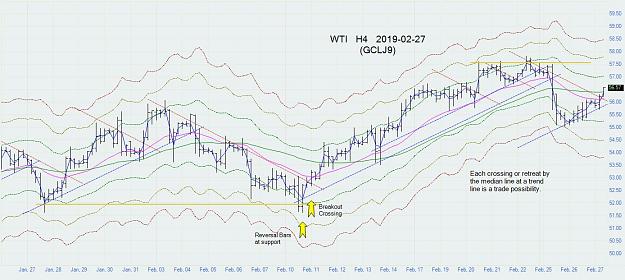
DislikedThe chart shows 2 systems. First, the Keltner Channel Gradient is one I put together. EMA20 is the centerline. The bands show distance from the CL, giving an indication of oversold/overbought conditions. I use the median line with it. Interested MQ traders are welcome to use my KeltnerChanGrad indicator linked below. The parallel trend lines system I got from Ata (EURUSD Only), who got it from his predecessors. All reds are parallel; all blues are parallel. Reds have equal, but opposite, slope from blues. On the H4 chart, a buy signal was given...Ignored
persistence and determination alone are omnipotent