{quote} man, you really have to work at your attitude, reported your attack, this is not a private forum where you can bark as you like, you started the thread you do not own it...
Ignored
No problem when twee talks to me I'll tell him the problem
{quote} This thread is meant for people's outlook for oil or gas in form of Ta or fa Respectfully The extra shit you add is not needed. If you can't contribute without being an asshole then get the fuck out of this thread Thanks
Ignored
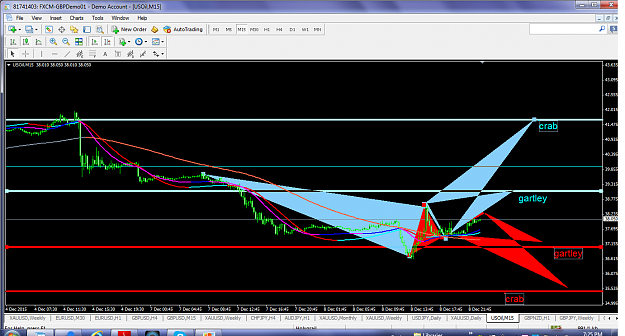
I posted a chart as you requested clearly showing what I believe to be support and resistance levels (mostly those since it is a down market).
You stated we are on support. On your last chart $40 was marked - which we are under. Are we not? Just checking?
where are the talk of $10 Oil pops $2.5 and you all disappear. No matter what anyone says this price we are in is support We either bounce or drop Thanks skyhok for posting a chart. To the others please post charts or else get the fuck off my thread if you nothing good to say Thanks
Ignored
i was the one talking about the 10$.
and yes i said it and i firmly believe it could eventually drop there, in case there will be no changes in the actual scenario.
I anyway posted my analysis earlier where i clearly stated the lower it goes the higher my interest in buying.
My prefered area where start buying.
My target.
My trade analysis.
Just an heads up like... hey it's going down but carful these levels are good to buy or can become.
{quote} I posted a chart as you requested clearly showing what I believe to be support and resistance levels (mostly those since it is a down market). You stated we are on support. On your last chart $40 was marked - which we are under. Are we not? Just checking? Also: under your multi-year trend line.
Ignored
Post a chart but don't criticize if others are not right and YOU HAPPEN TO BE RIGHT AT THE MOMENT.
Why are you posting here if you don't like what I'm saying.
A
{quote} i was the one talking about the 10$. and yes i said it and i firmly believe it could eventually drop there, in case there will be no changes in the actual scenario. I anyway posted my analysis earlier where i clearly stated the lower it goes the higher my interest in buying. My prefered area where start buying. My target. My trade analysis. Just an heads up like... hey it's going down but carful these levels are good to buy or can become. Now this said, i didn't mean to offend anyone. and glad to leave this hole useful to nothing. good luck...
Ignored
I apologize it wasn't your $10 remark I was referring to or your Ta
But meant for someone else in here who thinks he is mother hen and have right to correct everyone in here
Emotional control is such a big factor in trading, let alone dealing with emotional ups and downs of 'I've made good calls and .............. bad ones' and 'I'm more right than you are'.
The objective focus is on the markets and the charts, not the personal 'I', 'me' and 'you' 'your F......', etc. in trading forums.
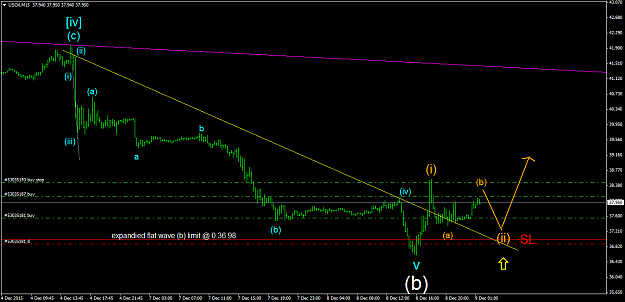
Trading potential market projections -
Present minor corrective move (ii) broke minor channel line and sitting on that support, indicates there's more upside potential at least for short term.
Initial SL @ 36.88, target to be determined. Small position sizing is used initially.
Attached Image (click to enlarge)
Elliott Wave for optimum entry, exit and risk management of trades
{quote} man, you really have to work at your attitude, reported your attack, this is not a private forum where you can bark as you like, you started the thread you do not own it...
Ignored
Point of note:
As the thread starter he can exclude anyone he wishes from posting in this thread.
Therefore, his insistence on a minimum level of politeness can be imposed if he chooses.
{quote} I apologize it wasn't your $10 remark I was referring to or your Ta But meant for someone else in here who thinks he is mother hen and have right to correct everyone in here
Ignored
no worries i'm fine!
sorry i misunderstood your words
Good morning FF! Emotional control is such a big factor in trading, let alone dealing with emotional ups and downs of 'I've made good calls and .............. bad ones' and 'I'm more right than you are'. The objective focus is on the markets and the charts, not the personal 'I', 'me' and 'you' 'your F......', etc. in trading forums.
For those who didn't read Goldman Sacks forecasts for 2016:
"there are high risks near term that the supply adjustment proves too slow as inventories continue to build and storage utilization nears high levels in the face of a mild winter, slowing EM growth and a potential lift of international sanctions on Iran."
Should surpluses breach current capacity, they see the risk of oil prices reaching just $20 a barrel."
For those who didn't read Goldman Sacks forecasts for 2016: "there are high risks near term that the supply adjustment proves too slow as inventories continue to build and storage utilization nears high levels in the face of a mild winter, slowing EM growth and a potential lift of international sanctions on Iran." Should surpluses breach current capacity, they see the risk of oil prices reaching just $20 a barrel."
Don’t be confused. Gold and silver prices will skyrocket in the future based on the fundamentals, not technical analysis. Not only will fundamentals be the important factor in the future, they have also been the leading indicators over the past 50 years.
I realize I will get a great deal of flak for stating this, but the facts presented below paint a pretty clear picture. Now, while it’s true that the many of the gold and silver analysts (including this independent analyst) under estimated the level at which the Fed and Central Banks could prop up the Greatest Ponzi Scheme in history… it’s better to have ones precious metal insurance a bit early than late.
I wrote this article in response to one of the guests on Al Korelin’s radio show. It was Avi Gilburt of ElliotWaveTrader.net. Avi told Al Korelin that the bottom of the precious market was around the corner. He said the four-year correction was nearly over and the next precious metal bull market was close at hand.
That sounded real nice until you read his recent article, Stop The Insanity As Misinformation About Gold Continues To Reign. Here is how Avi views most of the gold and silver (bug) analysts:
Why is it that most who are followed in the metals market and viewed by many as “experts” are so horribly wrong week after week, yet continue to present the same analysis week after week? Are the majority of the participants in this complex really that foolish to continually follow such clearly erroneous perspectives with the “hope” that it will eventually be right?
Avi’s comment here actually sounds logical to many precious metals investors who bought metal at higher prices hoping a recovery was soon at hand. Unfortunately, as gold and silver prices continued to decline, investor frustrations increased. While gold and silver analysts can be guilty of being wrong on the timing, they won’t be wrong on the FINANCIAL EVENT OF A LIFETIME.
I want to take certain parts of Avi’s article and show evidence why the fundamentals are the driving force in the value of gold and silver, not technical analysis. FUNDAMENTAL #1 The Key Driver For The Precious Metals Prices
In his article, Avi made this remark about the precious metal bull market:
I want to start by saying that, yes, this 4+ year correction will conclude soon. So, this market will begin another bull market in the not too distant future. You see, markets, over the very long-term, will continue to rise, as society continues to progress throughout history.
Avi believes the precious metal bull market will begin shortly and will continue to rise as society continues to progress throughout history. I don’t know if we will experience a long-term bull market, but rather a rapid rise in the value of gold and silver seems more likely. Furthermore, the notion that society and markets will continue to rise in the future indefinitely doesn’t seem likely either. I will discuss this at the latter part of the article.
I put this chart together (below) to show why the price of gold behaved a certain way since 1940. You will notice two lines in the chart. One shows the price movement of gold and the other of oil. If you look at the price of gold and oil from 1940 to 1970, they are basically flat-lined…. dead. Nothing going on there:
However, two amazing things took place in the beginning of the 1970 decade. Everyone knows Nixon dropped the Gold-Dollar peg (1971), but what was the other? U.S. domestic oil production peaked in 1970 and begin its inevitable decline. This caused serious consequences that were felt a few years later during the Arab Oil Embargo:
During Arab Oil Embargo, the price of oil shot up from $3.29 in 1973 to $11.58 in 1974. Then during the Ayatollah Khomeini-led revolution, Iranian oil production declined 72% from 1978 to 1980. This had a profound impact on the price of oil as it skyrocketed from $14 in 1978 to over $36 in 1980. Please look at the next two charts and see how this impacted the price of gold and silver:
While analysts continue to regurgitate that the rapid rise in the price of silver during the 1970’s was due to Hunt Brother buying, who in the living hell was buying gold and oil to drive up their prices?? Never get a good response for that question. Regardless, the price of oil increased 16 times its 1971 level, silver shot up 16 times and gold jumped 15 times. Interesting that the precious metals moved up about the same percentage as oil. Wonder how technical analysis could forecast the peak of U.S. oil production, the Arab Oil Embargo and the Iranian Revolution.
The same thing happened to the price of gold and silver from 2000 to 2012. As the price of oil shot up from $24 in 2001 to $111 in 2011, the price of gold and silver surged to a record high of $49 and $1,900 respectively.
Let me show you the same Gold vs Oil chart from above:
After the huge rise in the gold and oil price in the 1970’s, they both declined and traded in a range-bound fashion for the next two decades. It wasn’t until the rapid rise in the price of oil from 2004 until 2011, did the price of gold hit new highs. Again, the huge increase in both the price of silver and gold were not due to technical analysis or another overdue “Bull Market”, but rather from the fundamental change in the energy market. Investors need to realize ENERGY DRIVES the markets, not FINANCE. FUNDAMENTAL #2: Peak Oil Will Destroy The Market & Most Financial Assets
The one fundamental that Technical Analysts can’t chart on their graphs is the impact of peak oil on the value of most assets (or supposed assets) going forward. What we are heading into is much worse than anything Technical Analysis can forecast.
Unfortunately, most people still don’t realize the implications of peak oil. The valuations of most financial assets are based upon a financial principle called “Net Present Value.” Basically, it’s like a time machine. A current stock price is based on future earnings. Future earnings are based on economic growth. And economic growth is based on burning energy.. and not only energy, but a growing energy supply.
Jean Laherrere was kind enough to send me his updated Bakken Oil Chart. But before I show that chart, let me show the North Dakota oil production chart he sent me several months ago:
As we can see, the Bakken is the major portion of North Dakota’s oil production. The chart of Bakken shale oil production (green) has gone up almost exponentially. And, what goes up exponentially, comes down exponentially. According to Jean’s calculations (based on ultimate reserves), is that Bakken oil production will fall below 100,000 barrels per day by 2025.
Here is his updated chart of North Dakota and Bakken oil production:
Again, the (dark) green is Bakken oil production and the red is number of wells producing. You will notice something interesting happened at the top of the graph…. production (green) started to decline, while wells producing (red) continue higher. Thus, overall oil production is now falling while the number of wells grow. This is not a good sign.
We can see the peak more clearly in Jean’s final chart:
Now, while this is only showing the peak and decline of North Dakota (mostly Bakken) oil production, the other major shale oil fields in the United States will follow suit. When 2016 rolls around, we are going to see serious fireworks in the U.S. Shale Oil industry.
Last week I spoke with a gentlemen who is the president of his own independent oil company in Texas. He’s an oil geologist looking for conventional oil projects and knows just about everyone doing the same type of work in Texas, Oklahoma and Louisiana. He told me that the current situation in the U.S. oil industry is worse than what took place in 1985.
He went on to say there was serious trouble ahead next year for the medium and small oil-gas companies. Furthermore, he said that he couldn’t start working on new conventional oil projects unless the price of oil reached $60-$65. It’s now trading at $39, and looks to go much lower. In addition, the only reason the world was able to afford high oil prices was due to the massive increase in debt. I recently came to the realization, from the work of Gail Tverberg at Our Finite World , that the higher the price of oil goes, the higher the amount of debt that is needed. Which means, low or zero interest rates had to follow as this massive amount of debt is not serviceable at mid-high interest rates.
I will write more about DEBT-OIL-GDP in future articles. But, please understand that the massive amount of debt is not sustainable and a collapse is certain. Moreover, once this debt implodes or is written off, then U.S. and global oil production will collapse as the market can’t afford mid-high oil prices without adding even more debt.
This is the reason the value of most financial assets will implode. Unfortunately, I do not have a crystal ball as to know when it will occur, but we are witnessing current market volatility and geopolitical insanity due to peak oil… whether we realize it or not. FUNDAMENTAL #3: Peak Oil Makes Technical Analysis Completely Worthless
Avi Gilburt stating this toward the end of his article:
Folks, belief in fundamentals, physical demand, production, war, etc. have not and will not provide you insight into the turning point for gold. Gold will not bottom until the sentiment for it has gotten so bad that it will have only one way left to go. That is simply how markets work. Period. End of story. No exogenous event or fundamentals will change that, and if you have not learned that the hard way over the last 4 years, then there is truly no hope for you, or anyone you chose to follow. Yes, I know some of you will view me as harsh, but someone has to sound the wake-up call for the zombies that populate this market.
Avi says that no “exogenous event or fundamentals” will change the gold market. Well, I just showed during two-time periods when exogenous events (1971-1980 & 2001-2011) did impact the prices of gold and silver. Anyone with a heartbeat and decent eyesight can tell from the Gold vs Oil Chart 1940-2015, that the price of oil had a direct impact on the price of gold.
As I have stated several times, the coming surge in the value of gold and silver will occur during the collapse of the Greatest Financial Ponzi Scheme in history. This collapse will occur as we experience a precipitous decline of U.S. and global oil production. So, the price of oil will no longer be a factor in determining the price of gold and silver going forward… it will be the fall and collapse of U.S. and global oil production. People need to realize that the Fed and Central Banks can’t raise interest rates because we don’t have a CHEAP GROWING ENERGY SUPPLY. Where do you all think the “Interest” comes from?? Do you really think interest on a loan or bank account comes out of THIN AIR?? It comes from a growing energy supply. IMPORTANT: The Fed and Central Banks had to increase debt to continue growth. To get growth, you need a growing energy supply. To get a growing energy supply, we needed higher oil prices. To get higher oil prices, the Fed and Central Banks had to add a larger amount of debt. By adding more debt on top of more debt, INTEREST RATES had to fall because the service on the debt was unsustainable.
Can you imagine if the Federal Reserve and U.S. Treasury normalized interest rates? The annual U.S. interest payments on the debt would be over $1 trillion.. or more. How will this interest be serviced as U.S. oil production heads into the crapper?? You see, this sort of fundamental approach to forecasting in a peak oil environment can’t be charted using Technical Analysis. While I don’t know the date when the value of gold and silver will reset to substantially higher prices, it’s a matter of years, not a decade. Once U.S. oil production starts to fall precipitously over the next several years, this will put severe stress on the highly leveraged U.S. Financial Industry. Lastly, the notion that we are going to see society continue to progress in the future is a lousy one indeed. I would imagine any ancient Roman wise enough to make this same prediction back before the Empire collapsed as the great city fell from a population of one million down to 12,000, would have sounded like a real KOOK.
I truly believe the world will be a much different place by 2025. This will not be due to technical analysis, but the fundamental peak and decline of U.S. and global oil production. Investors waiting for bottoms and corrections in paper assets via technical analysis will wish they spent more time focused on owning physical precious metals.
Joined May 2012
|
Status: CoC'd again !
|8,539 Posts
It is my opinion that in the longer term the use of oil as a main source of energy is dead. There are only two applications where oil-burning cannot be practically replaced, at the moment, and they are road haulage and aircraft. This ability to quickly produce a lot of energy remains the preserve of oil and will continue until a cheaper and viable alternative emerges.
The technology to store energy, in batteries or whatever, or to generate electricity from wind and solar and any other non-oil based source continues to advance. The US is leading the charge with companies such as Tesla (who also make domestic energy solutions). China is right behind them.
Everyday the Sun gives us an enormous amount of energy; approximately 2 trillion megawatt-hours. That is currently around 300 megawatt-hours per head of human population per day. To put that in perspective, if you drove an Indy car flat out all day you would use 12 megawatt-hours (approx.), if you add the maximum consumption of a typical house running all day you add another 0.6 megawatt-hours. Total = about 5% of your 300MWhr share of the energy coming from the Sun. Since most of us don't drive like that, nor run our houses like that, you can see that our actual energy requirement is way below 0.1% of what is available.