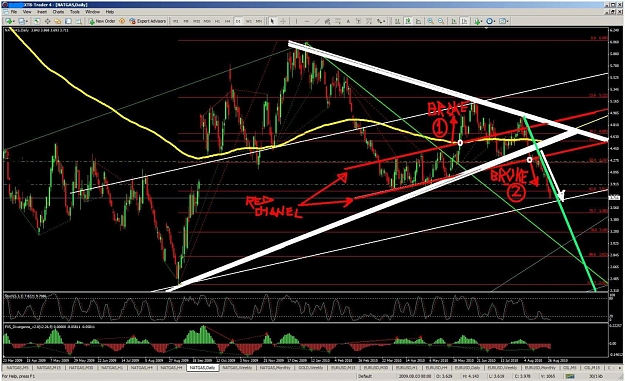
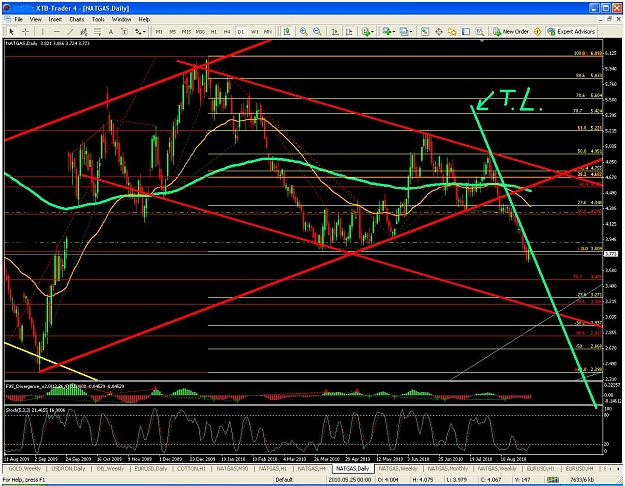
DAILY CHART. here is the picture.
RED CHANEL - price broke it at 1 up and at 2 down
WHITE TRIANGLE - price broke down and then broke 50 % fibo at 4.25 $ area . next broke was 61.8 at 3.8 $ area. next to break is 3.4 $ area at 70.7 % fibo .
RED CHANEL - price broke it at 1 up and at 2 down
WHITE TRIANGLE - price broke down and then broke 50 % fibo at 4.25 $ area . next broke was 61.8 at 3.8 $ area. next to break is 3.4 $ area at 70.7 % fibo .
Attached Image (click to enlarge)