• Home
  • Forums
  • News
  • Calendar
  • Market
  • Login
  • Join
  • User/Email: Password:
  • 11:06pm
Menu
  • Forums
  • News
  • Calendar
  • Market
  • Login
  • Join
  • 11:06pm
Sister Sites
  • Metals Mine
  • Crypto Craft
  • Forex Factory

Options

Bookmark Thread

First Page First Unread Last Page Last Post

Print Thread

Similar Threads

What is A book vs B book in Forex trading? 30 replies

A book forex brokers VS B book brokers, differences? 12 replies

Traders' Book Club 10 replies

The Book Club 5 replies

  • Trading Discussion
  • /
  • Reply to Thread
  • Subscribe
  • 1,316
Attachments: The Finance Book Club
Exit Attachments
Tags: The Finance Book Club
Cancel

The Finance Book Club

  • Last Post
  •  
  • 1 4142Page 434445 57
  • 1 42Page 4344 57
  •  
  • Post #841
  • Quote
  • Edited 1:18pm Oct 17, 2022 8:42am | Edited 1:18pm
  •  clemmo17
  • Joined Jul 2016 | Status: Member | 2,082 Posts
Chapter 1


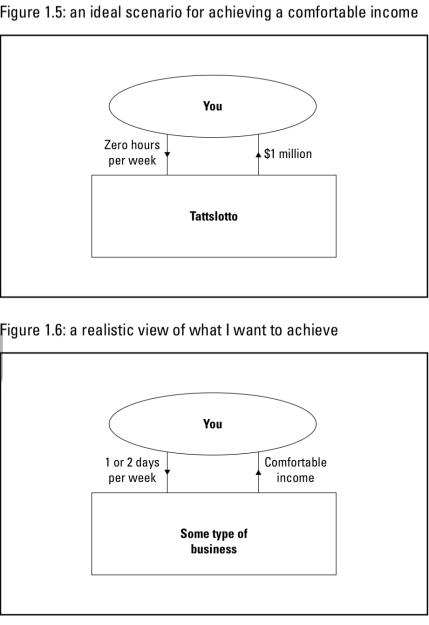
  1. When stockbrokers place shares with investors it is called the primary market.
  2. When shares are bought and sold in the stock market it is called the secondary market.
  3. Company profits are split and distributed regularly to shareholders as dividends.
  4. Stock markets also regulate publicly listed companies to protect investors’ interests.
  5. often people confuse ‘trading’ with ‘investing’ (Comparison to Buffett)
  6. ‘work hard and you’ll do well’ is true, but limited to the amount of hours in a day.
  7. we’re all selling our time, and the more your time is worth, the more you’ll get paid.
  8. a surgeon’s skill set is highly valued and therefore their time is very valuable
  9. AH’s problem with being a surgeon isn’t the pay, but the amount of time and effort to get the big pay packet.

“In fact, all I’m after is a comfortable income, but I want to achieve it without having to sacrifice very much of my time.”

Attached Image (click to enlarge)
Click to Enlarge

Name: FA989B6A-689B-4209-A421-68A5EE46438B.jpeg
Size: 180 KB


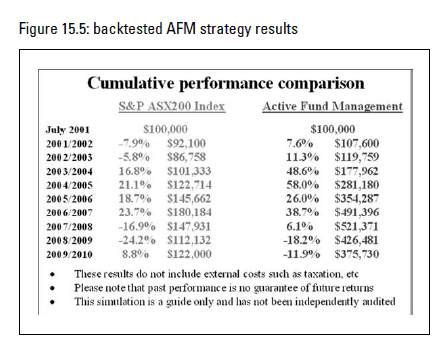
  1. With capital base of $400 000 and if you can live comfortably on $100 000 per annum, you can make a living trading shares
  2. risk of ruin becomes proportionally greater with borrowed funds
  3. takes most people somewhere between three and five years to develop the skills and acquire the market experience to trade successfully.
  4. income from share trading isn’t linear.
  5. you may have years where you earn as little as 10 per cent, then years when you make as much as 100 per cent
  6. noobs need to have executed at least 50 trades.
  7. if you need immediate income get a job

“Here’s the bottom line: in nearly 30 years of being a trader I have never come across a trading system that will make money week in, week out. In fact, some of the best systems I know, and have used, can spend up to six months (!?) under water (that is, operating at a loss).”

  1. share trading can be very cyclical
  2. Register a business name and/or set up appropriate financial structure(s).
  3. Set up a bank account and find yourself a broker (full service or online).
  4. Have a dedicated work space and a set timetable for when you trade.
  5. Establish a business plan with goals and timelines. Include your share trading education.
  6. Create a review process where you analyse your results and update your strategy(s).
  7. nothing more dangerous for a share trader than to become distracted.
  8. AH strongly recommends to stick with trading shares and do not try to become an ‘everything’ trader

“Once you are up and running as a trader, it’s very easy to get distracted by all the different financial products and markets”

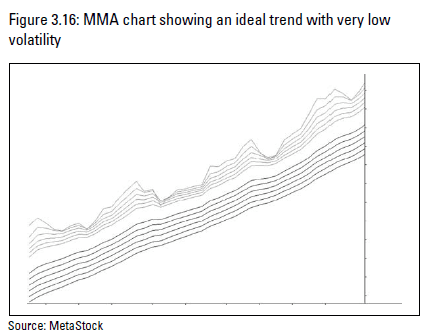
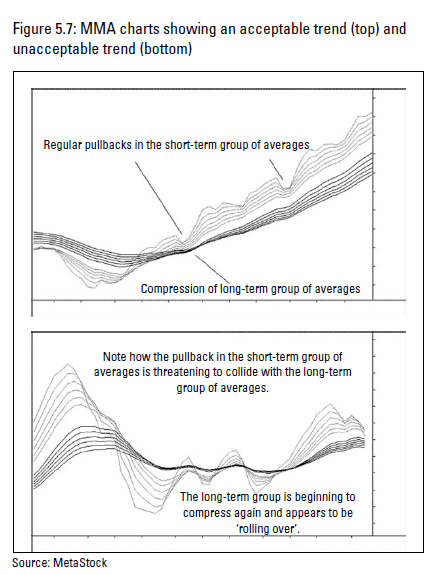
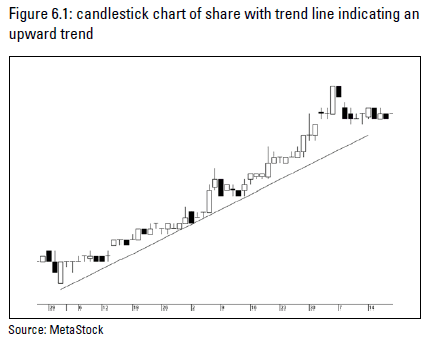
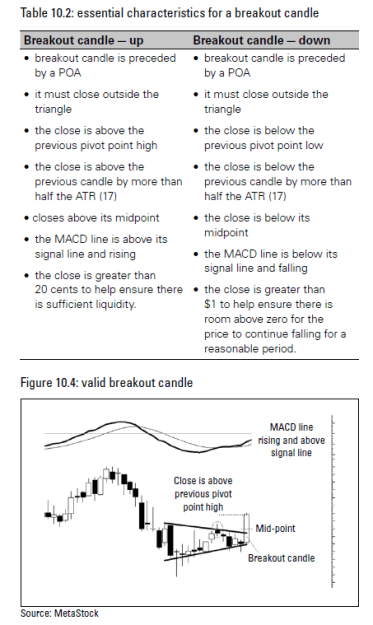
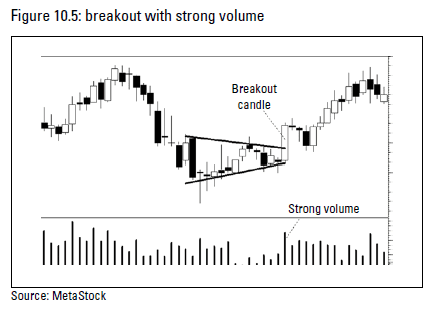
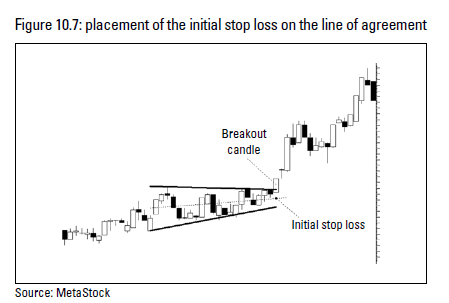
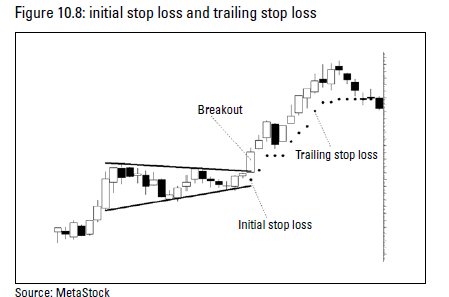
“A skill universal among successful traders is the ability to read charts. also known as technical analysis”

Attached Image (click to enlarge)
Click to Enlarge

Name: 1567B29A-4608-49D8-9A6B-FE6C1B705DFD.jpeg
Size: 89 KB
 
1
  • Post #842
  • Quote
  • Oct 17, 2022 9:04am Oct 17, 2022 9:04am
  •  DragonT
  • | Joined Feb 2021 | Status: Member | 130 Posts
Wow. What a nice thread I find. Hi.
I'd read this book: Trader Vic Methods by Victor Sperandeo
 
1
  • Post #843
  • Quote
  • Edited 1:21pm Oct 17, 2022 9:29am | Edited 1:21pm
  •  clemmo17
  • Joined Jul 2016 | Status: Member | 2,082 Posts
Chapter 2 & 3 (charting and modern TA)

Loyal readers will know my stance on 'TA' has changed drastically (to the negative) over the course of writing this thread and I'm now at the point where I can't won't devote much time to it.

  1. AH's strategies are based on short-term share price 'behaviour' ("price action?")
  2. Price movement is everything
  3. Factors that affect the long-term (fundamental analysis and macroeconomics) are irrelevant

"One of the few totally reliable forms of information to be found in the stock market is historical price activity." (totally reliable??)


  1. Price charts are based on fact (whose facts?)
  2. Company financials are manipulated by companies to look good (true)

    1. borrowing to meet dividend obligations
    2. spurious accounting
    3. etc


  3. Despite AH's criticism of fundamentals, he uses it himself 'in conjunction with other confirming factors'
  4. Interpreting charts requires 'discretion'
  5. Attached Image (click to enlarge)
    Click to Enlarge

Name: screenshot.png
Size: 12 KB
    Charting is 'an art more than a science' (and now whenever I hear that I know when to start tuning out)

Now Hull goes over the old standards.

  1. Price versus time (Gann!)
  2. Line-on-close charts
  3. candlestick charts emphasize the trading range between the opening and closing prices-which is of 'major significance'. However he never explains what he means by this.
  4. Trading Volume - the actual numbers are less important than the relative changes over time
  5. Time frame

    1. simple, but vital not to get confused and confine to a single one
    2. This book's strategies are 'short term' which means 3 weeks to 3 months.
    3. Weekly analysis
    4. Daily execution
    5. This is better than a lot of authors who keep us guessing.


  6. Intraday trading is too much work for AH

    1. Also he only knows one trader who ever was able to make money intraday, and it would be 'impossible to emulate'
    2. Consistent hourly profits is less realistic than consistent weekly profits which is already unrealistic


  7. Trendlines and how to draw them (you got this guys, just do whatever because it doesn't matter)
  8. Triangles -"essential" that when using trendlines to define triangles that you capture all the real bodies of the candlesticks (or what?? you might include a useless pattern in your analysis? Recall what AH said at the start about something needing to work all the time. Triangles do NOT work all the time.)
  9. Moving averages (including the HMA, the 'lag' winner)

    1. Includes tedious definitions and maths no one cares about anyway
    2. AH uses multiple MA's and calls them MMA (insert wrestling cage match gag)
    3. He admits their application is 'qualitative' not quant


Attached Image (click to enlarge)
Click to Enlarge

Name: screenshot.png
Size: 19 KB
Good thing we had this indicator to let us know this trend is not volatile.

  1. Price momentum (aha! but how is this TA?)

    1. It's TA because AH can measure momentum by using two different MAs and comparing their distances apart, apparently


Attached Image (click to enlarge)
Click to Enlarge

Name: screenshot.png
Size: 16 KB

  1. MACD - the 'signal line' has a purpose which is to lag behind price and generate 'crossover' signals (with a perfect 50% accuracy)

    1. To his credit AH points out an example where MACD generates false signals


  2. Volatility - measured with channels (actually useful)
  3. ATR - also possibly useful for the same reasons

AH admits that the effectiveness of all these methods is 'only his opinion'. So at least he's honest about that. Does this count as honesty overall?

Attached Image (click to enlarge)
Click to Enlarge

Name: screenshot.png
Size: 15 KB
Yeah, no.
He ends the chapter shilling for two paid charting software packages (you need high quality data!) and his newsletter (the alternative to buying expensive software is to buy expensive advice!)

The impression I'm left with is that AH is a reincarnation of J. Welles Wilder. He has invented a new thing and he will sell it to you, but whether it works or not is a matter of opinion, mainly his.
 
 
  • Post #844
  • Quote
  • Oct 17, 2022 9:44am Oct 17, 2022 9:44am
  •  clemmo17
  • Joined Jul 2016 | Status: Member | 2,082 Posts
Chapter 4 - Risk Management

Important stuff - but there's nothing new here

  1. expectancy — the financial viability of your trading strategy

    1. "average return that a trader can expect from each trade they enter,
      based on a combination of the win:lose ratio and reward:loss ratio of
      their trading system."
    2. Hull explains this using the coin-tossing metaphor that we've seen before; in fact I would guess he cribbed this from one of those other books
    3. Don't trade with a negative expectancy
    4. Hull's expectancy is over 20% or he gets 'concerned'.


  2. money management — managing your losses - so 'loss management'

    1. The mandatory 2% risk rule
    2. There are old traders and bold traders … but no old, bold traders.
    3. etc


  3. catastrophic risk — the possibility of an unexpected event

    1. "risk of ruin" outside Australia
    2. Portfolio risk = position risk × total number of open positions
    3. Portfolio risk should never exceed 20%, so max 10 positions using the 2% rule


  4. capital allocation — spreading your capital across different risk segments.

    1. Sector risk
    2. The solution is diversification
    3. 60% blue chips (boring but necessary says AH)
    4. 30% medium risk - active trading and breakouts
    5. 10% high risk - leveraged CFDs, forex and futures
    6. Don't dabble. All in.
      Attached Image (click to enlarge)
      Click to Enlarge

Name: screenshot.png
Size: 19 KB


Good stuff. Moving on.


  • Post #845
  • Quote
  • Edited 10:17am Oct 17, 2022 10:05am | Edited 10:17am
  •  clemmo17
  • Joined Jul 2016 | Status: Member | 2,082 Posts
Chapter 5 - 'Anatomy of a Trade'

"The trading premise for active investing is fairly straightforward. We
assume that fundamentally sound blue chip shares that are rising in
price will most likely continue to keep rising."


  1. Good fundamentals + rising share price = sustainable trend
  2. AH uses the 'all ordinaries index' to see if the broader market is still rising, and ensure he isn't counter-trend trading against it.

Attached Image (click to enlarge)
Click to Enlarge

Name: screenshot.png
Size: 18 KB

To find good blue chip shares:

  1. Top Stocks by Martin Roth
  2. StockDoctor by Lincoln Indicators Pty Ltd (website link redacted)
  3. "We then scan our group of fundamentally sound shares to locate the most
    profitable trading opportunities. We hold shares that are trending up with
    a rate of annual return (ROAR) of at least 20% but we only buy when the
    rate of annual return is at least 30%"

Attached Image (click to enlarge)
Click to Enlarge

Name: screenshot.png
Size: 15 KB

And then the final step is to make sure the trend isn't collapsing.
Attached Image (click to enlarge)
Click to Enlarge

Name: screenshot.png
Size: 39 KB

Entry, Hold, Exit
Attached Image (click to enlarge)
Click to Enlarge

Name: screenshot.png
Size: 16 KB
AH calls this the 'central cord'. I call it the 'critical path'.

On entry: "We need to wait for the market to reverse and turn upwards
again, thus showing evidence of buyer support."


"The green light is flashing after we have witnessed a rising week with a
closing price higher than the previous week’s close. When the green light is
flashing we act on a daily basis and ensure that our buy price is in the buy
zone; that is, equal to or below the central cord. Of course, it is possible for
the ‘market’ to get away and so occasionally you will miss an opportunity
to enter the market."
"Thus, both the following criteria must be met in order for an entry to be
signalled:
• buyer support as evidenced by a closing price higher than the
previous week’s closing price
• price activity is in the ‘Buy’ zone."

Attached Image (click to enlarge)
Click to Enlarge

Name: screenshot.png
Size: 18 KB

On Exit:
Attached Image (click to enlarge)
Click to Enlarge

Name: screenshot.png
Size: 16 KB

Taking profits is optional. Sell half if unsure. Exit if the market has been trending too long according to 'ROAR'.
"• price activity has closed at the end of the week below the lower
deviation
• the rate of annual return indicator has fallen below 20%."

The four components needed for a trading system
1. Trading premise
2. Search procedures
3. Entry triggers
4. Exit criteria

This seems specific, actionable, and reasonable. The bad taste from chapter 3 is already gone. I'm trying to think how this could go much wrong, and I suspect the only way is if you find yourself in a market environment like the present one and you don't have a way to trade shares short? I suppose another question is, with such sensible entry and exit procedures why do we even need to use any technical indicator (apart from the channel)?
 
1
  • Post #846
  • Quote
  • Oct 17, 2022 1:39pm Oct 17, 2022 1:39pm
  •  clemmo17
  • Joined Jul 2016 | Status: Member | 2,082 Posts
Chapter 6 - Active Trading Introduction


  1. an upward trend occurs when price activity moves upward from the left of a chart to the right
  2. a downward trend is where price activity moves downward from left to right.
  3. Attached Image (click to enlarge)
    Click to Enlarge

Name: screenshot.png
Size: 7 KB
    Good thing we have that trendline to confirm that's an upward trend, otherwise how could you tell?
  4. [active] trend[-following] trading is the most universally acknowledged successful premise for trading financial markets, especially shares.
  5. it's also relatively simple
  6. long only because the ASX doesn't have many derivatives for shorting
  7. shorter-term, because only technical merits are considered
  8. weekly timeframe filters out noise
  9. entries/exits executed on daily timeframe, especially if there's a fall
  10. countertrend trading is fatal
  11. Markets also go sideways so we can't always be in the market
  12. active trading is not a universal solution, so it should only be used when conditions are right

Active Trading Strategy

  1. Uses a 'weight of evidence' approach where signals from a variety of indicators are weighed before drawing conclusions
  2. Looking for:

    1. rising market (index) - check small ords
    2. rising sector
    3. rising share price - low volatility
    4. rising week - at least the past one week should be an 'upweek'.


  • Post #847
  • Quote
  • Edited Oct 18, 2022 1:36am Oct 17, 2022 10:57pm | Edited Oct 18, 2022 1:36am
  •  clemmo17
  • Joined Jul 2016 | Status: Member | 2,082 Posts
Chapter 7 - Tools of the Trade

Used to measure the four trends that make up the system

  1. rising indexes - moving average crossover charts, 10 & 30 day EMA
  2. rising sector - sector MMA and Hull's RoR indicator
  3. rising share - MMA charts and RoR
  4. upweek - check weekly price data
  5. The range indicator

Upper layer (outermost) - analysis of small ords and small ords indexes

Attached Image (click to enlarge)
Click to Enlarge

Name: screenshot.png
Size: 15 KB
"The rules for interpreting the crossover charts are very simple. Both of the charts must be crossed to the upside"

I like simple. Simple is good, but not always easy.

Don't countertrend trade. These charts must be very clear.

RoR calculation: "take the annual change of the share or sector, divide it by the current value of the share or sector and multiply by 100 to convert the fi gure to a percentage. Rather than use the change in value over one year, which is a little blunt, we take a three-month sample and then annualise the result. To provide a degree of smoothing, our values are taken from a 26-week Hull moving average (HMA), rather than the actual price activity itself."

Pick the top 3-4 sectors. If there aren't enough, leave money where it is. Risk management is not negotiable.

EMA values for MMA charts:
short-term group (grey lines) is 3, 5, 7, 9, 11 and 13
• long-term group (black lines) is 21, 24, 27, 30, 33 and 36.
Attached Image (click to enlarge)
Click to Enlarge

Name: screenshot.png
Size: 23 KB

Minimum RoR for entry: 120
Minimum RoR to hold: 80
This leaves a 'buffer zone' of 40 percent (120 minus 80)

"If this week’s closing price is greater than last week’s closing price, this
week is an upweek."

Range indicator
Attached Image (click to enlarge)
Click to Enlarge

Name: screenshot.png
Size: 10 KB

Uses the ATR to position the upper and lower lines. Upper line = upper deviation. Lower line = lower deviation. Central line = central cord.
Zone rules:

  1. sell zone — sell if the share closes the day in this zone.
  2. buy/hold zone — buy the share if it has closed at the end of the week in this zone and the price is higher than the previous week’s closing price. The share must be purchased at a price between the lower deviation and the central cord. Hold if already owned.
  3. profit take/hold zone — hold if the share price is in this zone or take profits if the position is up strongly from its initial purchase price (maybe sell half of the position).
  4. profit take zone — mandatory: take profits if the share price closes at the end of the week in this zone (in this instance sell the entire position). Optional: take profits if the share price is in this zone at any time.

  1. All trends eventually end

Trade Management

  1. work out your position size.
  2. know your buy price and
  3. your initial stop loss
  4. apply the 2 per cent risk rule
  5. lower deviation will be your stop loss
  6. maximum position size must never exceed 20 per cent of your total capital
  7. if a share’s RoR drops below 80 per cent, it has to be sold,
  8. the range indicator has a sell zone. If a share has an end-of-day close below the lower deviation, sell

AH's newsletter is the commercial version of this system.


  • Post #848
  • Quote
  • Oct 17, 2022 11:12pm Oct 17, 2022 11:12pm
  •  clemmo17
  • Joined Jul 2016 | Status: Member | 2,082 Posts
Chapter 8 - Active Trading Test Drive


  1. check the stop losses for all our open positions (very important, done first each week)

    1. see if any of open positions have closed below the lower deviation.
    2. See if any have had ROAR descend below 80%
    3. If yes to either of these, close the positions

  2. check the crossover charts (all ords and small ords)

    1. If these are crossed to the upside then you have green light to proceed

  3. select suitable sector MMA charts with the highest rates of return

    1. Rising for at least 2 months
    2. low volatility

  4. select suitable share MMA charts

    1. RoR above 80
    2. "best" shares in the "best" sectors (but no explanation how to winnow this list)

  5. check share data tables for valid entries

    1. upweeks only
    2. ROAR >= 120%
    3. Closing price in the buy zone, i.e. <= to value of the central cord && >= to the value of the lower deviation

  6. calculate purchase details and position size

    1. Weight each share for the portfolio using the 2% rule
    2. Attached Image (click to enlarge)
      Click to Enlarge

Name: screenshot.png
Size: 13 KB

  7. update records.

    1. Hull uses a custom spreadsheet he calls 'ActVest', but it's a spreadsheet.
    2. The spreadsheet includes a position size calculator which is nice
    3. Attached Image (click to enlarge)
      Click to Enlarge

Name: screenshot.png
Size: 27 KB


Seems elegantly simple and would be a hoot and a holler to test drive. For now though let's check out the second system - Breakout Trading


  • Post #849
  • Quote
  • Oct 18, 2022 12:00am Oct 18, 2022 12:00am
  •  clemmo17
  • Joined Jul 2016 | Status: Member | 2,082 Posts
Chapter 9 - Intro to Breakout Trading
Trend trading is 'bulletproof' in trending markets, but price doesn't always trend. So enter, breakout trading.

"Breakout trading is about identifying breakouts after periods of price consolidation, then exploiting the rallies that follow for profit."

  1. look for a significant price jump from a period of consolidation and buy into the rally that follows.
  2. Attached Image (click to enlarge)
    Click to Enlarge

Name: screenshot.png
Size: 9 KB
    Works well in non-trending markets as you don't have to wait for weeks for confirmation of entry
  3. Agile and nimble
  4. Consolidation pattern looks like a side-leaning triangle
  5. The break is usually a strong-looking single candle
  6. Attached Image (click to enlarge)
    Click to Enlarge

Name: screenshot.png
Size: 8 KB
    The point of the triangle is the 'Point of Agreement' (POA)
  7. Attached Image (click to enlarge)
    Click to Enlarge

Name: screenshot.png
Size: 10 KB
    If a market remained at a POA forever they couldn't exist. Markets must constantly move in order to survive.
  8. Disagreement is necessary for a market
  9. AH uses the MACD with default settings to measure momentum after a breakout

    1. Stay in the trade while the MACD line is rising
    2. Exit when it starts to fall
    3. trade only the breakout rally and exit as soon as it finishes.

Attached Image (click to enlarge)
Click to Enlarge

Name: screenshot.png
Size: 11 KB

A breakout candle has the following characteristics:
• it closes outside the boundaries of the triangle
• it is tall, with its close near its high
• volume may be strong on the breakout.
 
 
  • Post #850
  • Quote
  • Edited 12:34am Oct 18, 2022 12:24am | Edited 12:34am
  •  clemmo17
  • Joined Jul 2016 | Status: Member | 2,082 Posts
Chapter 10 - Tools for Breakout Trading


  1. it is not a good idea to entirely trust ourselves with the final decisions when trading

    1. have qualitative measures near the beginning
    2. and follow through with mechanical measures


  2. qualitative measures are used in searching and filtering
  3. entry trigger, position size and exit signals are mechanical (probably a good combination in trading algorithmically as well)
  4. Attached Image (click to enlarge)
    Click to Enlarge

Name: screenshot.png
Size: 12 KB
    for the breakout candle to be signifi cant, it must not only
    break out of the triangle, but it must also make a new high (or low)
    by moving beyond the previous pivot point.
  5. Is AH using 'pivot point' in the usual sense here? I think he means a 'local high/low or relative price extrema' A 'fractal'. A 'swing high or low'.
  6. Attached Image (click to enlarge)
    Click to Enlarge

Name: screenshot.png
Size: 9 KB
    Attached Image (click to enlarge)
    Click to Enlarge

Name: screenshot.png
Size: 27 KB
    volume confirmation
  7. Attached Image (click to enlarge)
    Click to Enlarge

Name: screenshot.png
Size: 9 KB
    gap preceding the breakout candle is also a strong signal
  8. price-related stop loss at the midpoint of the triangle
  9. Attached Image (click to enlarge)
    Click to Enlarge

Name: screenshot.png
Size: 8 KB
    trailing stop loss using a chandelier exit with a 2(ATR(17)) displacement. A 1ATR move is expected. 2ATR is 'excessive'.
    Attached Image (click to enlarge)
    Click to Enlarge

Name: screenshot.png
Size: 8 KB
  10. With the stop in place we can then calculation position sizing with the 2% rule.
  11. Entry limit - if price moves too far stop chasing. The limit is 2.5(ATR(17)) above the stop loss. It is a fixed line for the entire trade.
  12. AH is one of the few trading book authors with a still-functioning website that actually has what he promises you'll find on it. Namely a link to the backtesting results. https://alanhull.com/uploads/documen...ingResults.pdf
    This system has fallen on some hard times in recent years. Which actually seems odd considering that this is the system that is meant to be the antidote to non-trending markets. If markets are trending strongly this system shouldn't necessarily suffer, right? Does anyone have any theories? Breakouts aren't following through as much as they used to? Or is it good old pattern-erasure? I would go with that.


  • Post #851
  • Quote
  • Oct 18, 2022 12:42am Oct 18, 2022 12:42am
  •  clemmo17
  • Joined Jul 2016 | Status: Member | 2,082 Posts
Chapter 11 - Applying the Breakout trading strategy
You'd think this chapter was the counterpart of chapter 8 for the trend trading strategy but it appears to be additional. Why??

Attached Image (click to enlarge)
Click to Enlarge

Name: screenshot.png
Size: 12 KB

Attached Image (click to enlarge)
Click to Enlarge

Name: screenshot.png
Size: 8 KB

Attached Image (click to enlarge)
Click to Enlarge

Name: screenshot.png
Size: 11 KB

  1. Search for valid breakouts
  2. Select from this search

    1. Sector risk guidelines
    2. Extra 'breakout characteristics' guidelines (?)

  3. Calculate stop loss and entry limit
  4. Calculate position size (>20% of total capital)
  5. Enter between stop loss and entry limit
  6. Exit when MACD line turns down
  7. Exit when the price-related stop loss is triggered

No reason to say more than this but of course the chapter does go on. Books have to be thick.


  • Post #852
  • Quote
  • Oct 18, 2022 12:58am Oct 18, 2022 12:58am
  •  clemmo17
  • Joined Jul 2016 | Status: Member | 2,082 Posts
Chapter 12 - Breakout strategy test drive
I'm going to skip this as it doesn't really offer new info. It's mainly an ad for the newsletter and the 'ActVest' system.

Chapter 13 - The biggest problem is YOU
I'm sure that's true but this is a trading psychology chapter that contains no new ideas. So I'm going to skip this too.

Chapter 14 - Keep Your Eye on the Ball
Is kind of interesting.


  1. Service providers who want to be your friend are mostly just out to get your money. Does this surprise anyone?
  2. You have to know yourself well enough to know how you can make user of their service or else block them out.
  3. Otherwise they will prey on your psychology.
  4. Product vendors promote intraday trading
  5. Business channels pump up a sense of excitement even in dull market days
  6. A good story often gets in the way of the facts
  7. Nobody really knows anything (especially about the future), but nobody wants to admit it
  8. Stockbrokers can lead you up a garden path. Their job is to sell stocks.
  9. Don't be seduced by other markets - currencies, indexes, bonds, commodities

    1. It takes nearly a lifetime just to know how to trade one market

  10. Trading software program vendors - highly dubious

    1. "One other common hallmark of these ‘black box’ trading solutions is that they often originate from overseas and are sold locally by an ‘authorised’ Australian agent. This agency arrangement is needed to overcome our fairly strict licensing regime that’s designed to keep Australian consumers safe. Of course, when things go horribly wrong, the overseas product provider blames the agent and the agent blames the overseas product provider."
    2. Which reminds me of the licensing arrangement for most Aussie forex brokers. When something goes wrong blame the liquidity provider who is in another jurisdiction.
    3. If you do buy a program demand transparency

  11. Derivative trading with high leverage "isn't easy" (does that mean it's more difficult than share trading? Probably.)

    1. Options have their own risks

  12. Take your time. Start with shares and then branch out if you must.


  • Post #853
  • Quote
  • Oct 18, 2022 1:29am Oct 18, 2022 1:29am
  •  clemmo17
  • Joined Jul 2016 | Status: Member | 2,082 Posts
Chapter 15 - Blue Chip Share Trading

  1. AH recommends investing $2 in blue chips for every $1 in short-term trading
  2. Not everyone can handle interpreting an MMA chart says AH
  3. So try AFM (Active Fund Management)

    1. AFM "is a mechanical adaptation of active investing where the use of MMA chart interpretation has been completely eliminated. Rather, it relies on a set of very robust filters and indicators that virtually mechanise the entire trading process. The basic premise behind this strategy is still the same as that of active investing — to seek out fundamentally sound shares that are rising in price."
    2. "Using the ASX200 constituent shares as its universe, the AFM strategy simply applies an appropriately tuned rate of annual return indicator to all 200 shares, then puts them in descending order, according to their rate of annual return."
    3. Scoop off the top 10 fastest rising shares (reminds me of Thorpe's MUD strategy)
    4. If the stock is in the ASX200 it must have good fundamentals it's assumed

Optimization

  1. Cull under-performing shares (any that fall off the top 40 list)(this rings some alarm bells)
  2. "If we eliminate the two shares that are trending down, the average performance, defined by the index, will improve considerably." (are you sure??)
  3. Apply a trailing stop-loss called a 'drawdown stop loss'.

    1. "the drawdown stop loss, which is created by subtracting a fixed percentage from the highest closing price in an uptrending market. The value of the drawdown stop loss is not allowed to fall back with price activity"
    2. Attached Image (click to enlarge)
      Click to Enlarge

Name: screenshot.png
Size: 14 KB
      When a share stops out, replace it with one from the top of the list

  4. "here’s the really clever bit: by applying a 20
    per cent drawdown stop loss to each share and having our money
    spread across 10 shares, we are applying the 2 per cent risk rule —
    20 per cent of 10 per cent is 2 per cent. If one of our shares is stopped
    out, our largest possible loss from that position is 2 per cent of our
    total capital."

Here's something even cleverer. Instead of wasting your time with this just buy an ASX200 ETF, maybe?

Attached Image (click to enlarge)
Click to Enlarge

Name: screenshot.png
Size: 32 KB
AH addresses this by showing performance between his AFM strategy and the ASX200 in the weirdest possible way. Why not just show us an overlay chart?? Still, sure enough the final total is much higher with his system. I wonder how it's doing today?

Again, to his credit, AH has the backtests for this system (he calls it the 'Blue Chip Report') although you have to do some digging to find them.

Up to 2022 it seems that most years the BCR does outperform the ASX200 but sometimes it doesn't. Like in July 2018-2019
Attached Image (click to enlarge)
Click to Enlarge

Name: screenshot.png
Size: 15 KB
However the newsletter says 'Alan advised a defensive approach resulting in reduced losses.' Well, it's good to be the expert I suppose. The problem is the book doesn't talk about what this defensive approach might be.

However, again to his credit, AH seems scrupulously honest and in years when the BCR outperforms the ASX there is sometimes a note like this one. "Alan advised trading index ETFs in preference to shares, which achieved a much lower return."

Well, so much for discretion. I have a lot more to say about this especially with regards to a very discretionary trader like Brent Donnelly, but that's for another time. For now, we have reached the end of the book.

"Ultimately, it is the market that teaches us all how to trade. The trick is to survive long enough to learn the lessons."

So what do I think?
Pros:

  1. AH is a plain speaker, no convoluted jargon
  2. Simple as it gets without being hand-wavy
  3. Probably profitable, most years. Trends are real.
  4. Not too bloated with unnecessary material

Cons:

  1. Chapters on technical analysis and trading psychology are basically copy-pastes of other less interesting authors
  2. If we take AH at his word this is only useful for the ASX, but I think he knows nobody really believes that.

So, better than I expected. In fact, quite good and despite the flaws I'm probably going to recommend it.

 
1
  • Post #854
  • Quote
  • Oct 18, 2022 1:35am Oct 18, 2022 1:35am
  •  clemmo17
  • Joined Jul 2016 | Status: Member | 2,082 Posts
Up next: So far the poll-voters are 1:0 vs. Clemmo's Conjecture so I'm going to keep giving them the benefit of the doubt and go with the second-highest voted book. The problem is that there is currently a 5-way tie for second place so if anyone wants to go ahead and vote in the book poll (first page of the thread) and break the tie, now's the time.
 
1
  • Post #855
  • Quote
  • Oct 22, 2022 11:03am Oct 22, 2022 11:03am
  •  clemmo17
  • Joined Jul 2016 | Status: Member | 2,082 Posts
Nobody broke the tie,
Attached Image (click to enlarge)
Click to Enlarge

Name: screenshot.png
Size: 512 KB
Damn you. Damn you all to hell.

So I'm just going with the one with the most votes at the top of the list which is

Montier's Behavioural Investing.
 
 
  • Post #856
  • Quote
  • Oct 22, 2022 11:51am Oct 22, 2022 11:51am
  •  clemmo17
  • Joined Jul 2016 | Status: Member | 2,082 Posts
SECTION I: COMMON MISTAKES AND BASIC BIASES
Chapter 1 Emotion, Neuroscience and Investing: Investors as Dopamine Addicts

Haha, dopamine addicts! Come on! Who does anything because they're addicted to dopamine?!?

Attached Image (click to enlarge)
Click to Enlarge

Name: everyone2.jpg
Size: 27 KB
Yeah. Everybody. The whole planet is run by motherflippin' dopamine.

The book is the culmination of a six year research project. Montier's old book (2002) was on Behavioural Finance. We're learning so much about human behaviour every year (much of it wackadoo) that in the intervening time this new book is sooo much better. So let's get started.

  1. People are hard-wired for the short-term (because life is short, and food was scarce)
  2. People are hard-wired to follow the herd (the worst forum threads are the most popular. We'll be safe in the midst of mediocrity!)
  3. Self-control is hard. And the more we use it the more it gets used up (but I read something that said the study that showed this was flawed)
  4. The good news is people can change because brains are plastic. Neurons can be re-arranged and you can make new ones.
  5. Neuroeconomics combines psychology, economics and neuroscience.

Spock or McCoy?
This is a reframe of the Kanhemannian idea of system1/system2 modes of thinking. System1 (fast, emotional) is McCoy. System2 (slow, effortful) is Spock.

Attached Image (click to enlarge)
Click to Enlarge

Name: screenshot.png
Size: 84 KB

The Primacy of Emotion
We needed emotions before we needed logic, so emotions evolved first and they are the default, go-to method for most people. Montier goes into this in way more detail than necessary telling us about parts of the brain, etc.

Emotions: Body or Brain?
We usually think that our brains produce an emotion (say, sadness) then our body reacts, (say, by crying) but even back in the days of William James psychologists have found evidence that it works the other way around. Your body produces a response (sweating, etc) and your brain tries to figure out why you're feeling that way by associating it with an emotion. Crazy, huh? This explains why you can trick yourself into being happy/sad/angry by making the corresponding face associated with those emotions and why people who are asked to nod as a review of a product give higher ratings.

"we have a tendency to trust our initial emotional reaction and correct that initial view “only subsequently, occasionally and effortfully”

Emotion: Good, Bad of Both?
We can't make decisions without emotions, even though they can lead us astray. Without them we're like Buridan's ass, which I've referenced before.

Self-Control is Like a Muscle
Except maybe it's not.

Hard-Wired for the Short Term
“Investment based on genuine long-term expectation is so difficult to-day as to be scarcely practicable.” - Keynes

Hard-Wired to Herd
There's safety in numbers and has been forever. Except in trading. Then it's not so good.

Plasticity as Salvation
"With emotions we cannot control ourselves, and without them we cannot make decisions." Depressing, right? But the good news is we can change. The book will show us how! Trust in the book!
 
1
  • Post #857
  • Quote
  • Oct 22, 2022 12:23pm Oct 22, 2022 12:23pm
  •  clemmo17
  • Joined Jul 2016 | Status: Member | 2,082 Posts
Chapter 2 Part man, part monkey
Because we're just animals dressed up in clothes (sometimes, not even) we are prone to lots of biases. I think we've gone over much of this already.

  1. Be less certain in your views, especially if they are forecasts.
  2. You know less than you think you do.
  3. Try to focus on the facts, not the stories.
  4. More information isn’t better information.

    1. ‘The greatest obstacle to discovery is not ignorance – it is the illusion of knowledge.’ -Boorstein, echoing Feynman

  5. Listen to those who disagree with you.

    1. while experts may know more than non-experts, they are also likely to be even more overconfident than non-experts.
    2. During the Covid era we have probably seen this many times
    3. Confirmation bias

  6. Examine your mistakes, failures aren’t just bad luck.

    1. write things down so you can see the reasoning behind your decisions

  7. You didn’t know it all along, you just think you did.

    1. hindsight bias

  8. Judge things by how statistically likely they are, not how they appear.

    1. Investors confuse the dimensions of strength vs weight.
    2. For example a glowing reference letter is a strong data point for a candidate, but if it was written by their mother then we should weight it lower
    3. Investors tend to be overconfident in firms that have produced good historical returns, but they undervalue the importance of dividend returns

  9. Big, vivid, easy to recall events (like terrorism) are less likely than you think they are.

    1. recency bias

  10. Don’t confuse good firms with good investments or good earnings growth with good returns.
  11. Use reverse-engineered models to avoid anchoring on the market prices.

    1. "Take market prices and check what they imply for growth, then assess whether there is any hope of that growth actually being delivered."

  12. Don’t take information at face value; think carefully about how it was presented to you.

    1. Inattentional blindness - when you're preoccupied with a demanding task you could miss something obvious like a person in a gorilla suit

  13. Sell your losers and ride your winners.

    1. "status quo bias" - a loss isn't a loss until I take it
    2. The endowment effect - people are reluctant to part with something they own, even if they've only had it for a short time
    3. loss aversion - people feel losses more than they feel gains

 
1
  • Post #858
  • Quote
  • Oct 22, 2022 12:42pm Oct 22, 2022 12:42pm
  •  clemmo17
  • Joined Jul 2016 | Status: Member | 2,082 Posts
Chapter 3 - Take a Walk on the Wild Side

Impact Bias

  1. People are bad at forecasting, and that includes predicting feelings
  2. People are not very good at predicting how they are going to feel after certain situations occur.
  3. People think that some events will affect them for longer than they really do


Empathy Gaps

  1. People underestimate how much their emotions are going to influence their choices
  2. "we all tend to believe that other people’s actions reflect their ‘personality’ or underlying disposition, whereas we believe our own actions are the result of the situation in which we find ourselves"


Attached Image (click to enlarge)
Click to Enlarge

Name: screenshot.png
Size: 23 KB

Between impact bias and empathy gaps, we can do more about impact bias. The only thing you can do for empathy gaps is to have some kind of pre-commitment device in place. For example, I promise to sell this stock if it goes down by 8%. When you aren't emotional (when the stock is up) it's easy to say you will do what your rational mind tells you. When the stock is down and you are emotional, it's way harder to follow through on your choice. This reminds me of Seinfeld's 'daytime guy/nighttime guy'.

Combating the Biases

  1. Have a higher EI (emotional intelligence)


  • Post #859
  • Quote
  • Edited 3:59pm Oct 22, 2022 1:11pm | Edited 3:59pm
  •  clemmo17
  • Joined Jul 2016 | Status: Member | 2,082 Posts
Chapter 4 - Brain Damage, Addicts and Pigeons
Montier argues that those with less fear (the groups mentioned in the chapter title) outperform normal people in a game where taking risks is rewarded. However in investing, taking on risks is not always rewarded. I don't really think this chapter tells us much at all. It's padding out the book. They advise turning off your emotions when you're investing and turning them back on the rest of the time but since that's not possible for most people, what use is it?

Chapter 5 - What do Secretaries’ Dustbins and the Da Vinci Code have in Common?
The answer is: nothing important. The market moves randomly much of the time but everyone needs to find a reason for every move. This is a 'sub-industry of noise generators'.

  1. Larry Summers (former US treasury secretary) showed, in a paper written in 1989, that over half of all the largest moves in stock markets appear totally unrelated to fundamentals
  2. After a prolonged and overbought bull trend, "sudden unexplained declines are to be expected. That is the very nature of a cynical bubble". Mind games and mean reversion!
  3. Markets are seasonal and cyclical. Most investors ignore these patterns, but they will listen to talking heads on Bloomberg. Irrational.
  4. Secretaries who get memos in a standard format will follow instructions to do things that are pointless (because they are being paid?!) and this is supposed to be evidence that people will 'dumbly' process information when it's in a standard expected format. This explains why 'noise-peddlers' survive in efficient markets (and maybe goes some distance to explain Clemmo's Conjecture, but I'm not sure I buy the reasoning).

Chapter 6 - Limits to Learning

  1. The 'evidence' shows most people are not good at learning from their mistakes. In fact most people don't even realize they've made a mistake.
  2. There are four biases that particularly 'shield' our egos (important though that is) and stop us from learning from mistakes
  3. Written records can help overcome 'attribution bias' - the tendency to attribute success to skill and failure to bad luck
  4. 'Hindsight bias' makes us think we knew something all along once we learn the answer

    1. To fight this ask what didn’t occur and what could have led to an alternative outcome?


  5. The illusion of control - we tend to attribute outcomes to our actions even though we might have had nothing to do with the result
  6. Confirmation bias - if you weigh yourself several times and find that the scale says you're fat 3 times and not fat 1 time, you're more likely to take the outlying scale reading and assume you're not fat. Or as in my case, just stop weighing yourself. However Montier calls this 'feedback distortion' but how is it different from confirmation bias?

 
3
  • Post #860
  • Quote
  • Edited 12:27pm Oct 24, 2022 7:11am | Edited 12:27pm
  •  clemmo17
  • Joined Jul 2016 | Status: Member | 2,082 Posts
Chapter 7 - Behaving Badly
This chapter begins with a test that was given to 300 fund managers. It’s part IQ test and math quiz, each question designed to expose a different inherent bias. If you go into it expecting to be tricked, you can do pretty well without having to do much thinking.

The results from the test are fairly interesting, if you’re into puzzles and psychology, with the most interesting result, for me personally, being “Keynes beauty contest”. It’s a bit difficult to describe but I’ll try my best but first let’s go over the general observations.

Overoptimism

  1. People tend to be far too optimistic about their own abilities

Confirmatory Bias

  1. People prefer to find evidence that confirms their own view even if it’s far more useful to find evidence that refutes it. This is not because you’re likely to change your mind. Almost all conversation is guaranteed to never do that. Just look at how people react to political viewpoints that contradict their own. The benefit is in finding the flaw of the other persons point of view. If you can’t identify it then it’s likely that you don’t see the flaws in your own viewpoints.

Representativeness

  1. The more categories that you put something into the less likely it is to happen. However people get this wrong all the time because we tend to assume that certain types of things fit more often into certain types of categories.

The Cognitive Reflection Task (CRT)

  1. This does a lot of heavy lifting in this chapter and I suspect in the rest of the book. Basically it measures how much people use the Spock style of thinking. It only uses three questions but they all seem to have a simple answer on the surface. The actual answer requires more careful thinking. Again if you go into this expecting that you’re being tricked you’re more likely to use system 2 type thinking so I would guess this is also a measure of paranoia. However the book doesn’t make any mention of this.

Anchoring

  1. It is depressingly easy to fool people by getting them to think about something else because they will then use that as a reference frame for making future calculations.

Framing

  1. The way that survey questions and other types of statistical information is presented to us has a big influence on how people will respond to it.

Loss Aversion

  1. As mentioned before a lot of people will gamble to try to avoid a loss rather than doing the rational thing which is to just take the loss even though it’s certain to happen.

Keynes’s beauty contest

  1. This one was the most interesting to me personally because I have never heard of it before. It comes from something Keynes wrote, where he despairs of anyone in the marketplace making rational long-term investments based on fundamental values. Instead he compares the market to a game of musical chairs or a game of old maid where a bad card is passed around from person to person and you hopefully don’t end up with it before the game ends.
  2. I found this particularly fascinating because I also have thought of all forms of trading as a type of musical chairs. If you place a trade and are able to earn some profit before the music stops then you win. This metaphor was also used in the movie ””Margin Call” where the character played by Jeremy Irons says “I don’t hear the music.”
    Attached Image (click to enlarge)
    Click to Enlarge

Name: 640401A8-83DC-4C4A-A110-4934AC5F375A.jpeg
Size: 53 KB
    “Sell it all today”
  3. But it gets even more interesting when Keynes compares it to orders of thinking. He uses the example of a newspaper beauty contest. Unfortunately I don’t think these exist anymore and I don’t recall ever seeing one but it’s a photo of a series of women and you have to guess who the readers of the newspaper will select as the most beautiful. It’s important that you don’t use your own opinion of the women’s beauty to make your decision but rather you have to put yourself in the minds of the general public and try to guess what their reactions will be. And you can keep on doing this to an absurd extreme where I’m not just trying to guess what the public reaction will be but try to guess what other people playing the game will try to guess. I think it’s very much like this in terms of the mind games that are played in public markets.
  4. How many people who invested in Tesla before it crashed really believed in the actual value of Tesla? How many investors were really just guessing what the general public would be thinking?
  5. The straight up unsophisticated valuation of a security is first order thinking. Trying to guess what the general public will think about the value of the security is second order thinking. Trying to guess what the market will think about the general public‘s thoughts about the value of a certain security is third order thinking and I think that’s where we still are today but increasingly a fourth order thinking is coming into play especially with the use of algorithms.

Monty Hall Problem

  1. this old chestnut is popular on the Internet and I think I’ve even talked about it here in the book club, I forget. Either way I leave it as an exercise for the curious researcher.

Montier concludes the fund managers are just as susceptible as the general public to all of the usual biases.

 
2
  • Trading Discussion
  • /
  • The Finance Book Club
  • Reply to Thread
    • 1 4142Page 434445 57
    • 1 42Page 4344 57
1 trader viewing now
  • More
Top of Page
  • Facebook
  • Twitter
About EE
  • Mission
  • Products
  • User Guide
  • Blog
  • Contact
EE Products
  • Forums
  • Calendar
  • News
  • Market
EE Website
  • Homepage
  • Search
  • Members
  • Report a Bug
Follow EE
  • Facebook
  • Twitter

EE Sister Sites:

  • Metals Mine
  • Crypto Craft
  • Forex Factory

Energy EXCH™ is a brand of Fair Economy, Inc.

Terms of Service / ©2023