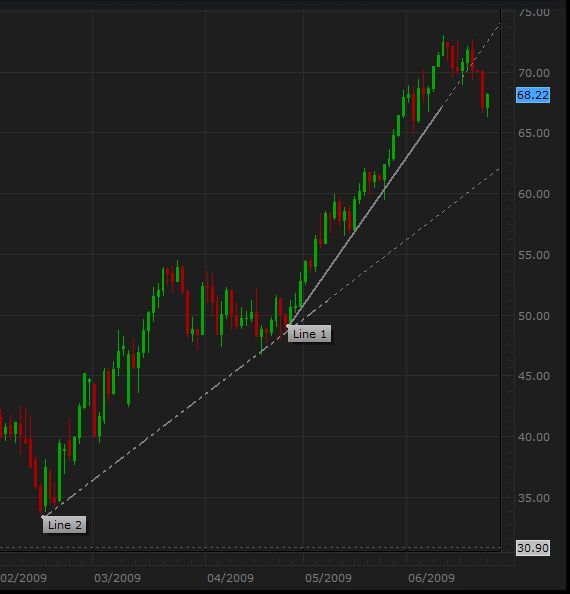
Crude moved lower in early trading touching an intraday low of $66.79 and looked poised for another sell off. However, the 9 day moving average proved once again good support level (a common feature of this short term up trend).Failure to cross below this indicator has brought additional buying power pushing crude higher to close at $68.74 giving a 69 cents gain for the day. So the consolidation in crude continued with the chart still showing an overall bullish picture for the near term.
The short and medium term trends are bullish and the long term trend is bearish.
WTI:
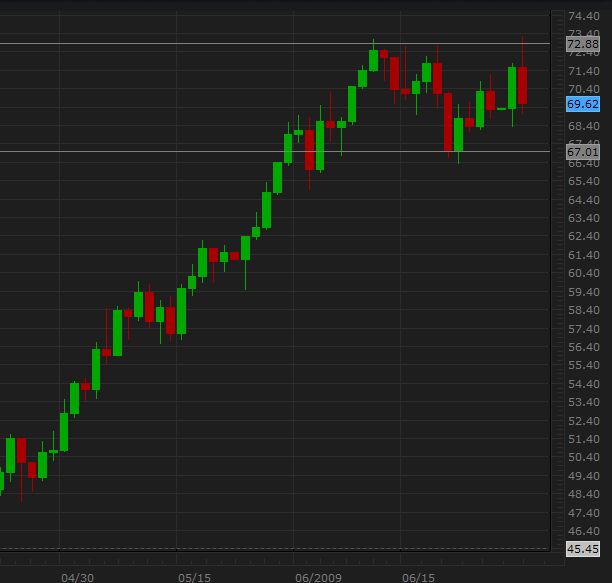
Support: $66.79 (yesterday's low) Resistance: $70.40 (high of 05/06/09)
Support: $66.40 (low of 01/06/09) Resistance: $69.60 (high of 04/06/09)
Support: $65.92 (low of 04/06/09) Resistance: $68.95 (yesterday's high)
OIL (BRENT):
Support: $66.88 (yesterday's low) Resistance: $70.15 (high of 16/10/08)
Support: $65.49 (low of 01/06/09) Resistance: $69.91 (high of 05/06/09)
Support: $64.91 (low of 03/06/09) Resistance: $68.79 (yesterday's high)
The short and medium term trends are bullish and the long term trend is bearish.
WTI:
Support: $66.79 (yesterday's low) Resistance: $70.40 (high of 05/06/09)
Support: $66.40 (low of 01/06/09) Resistance: $69.60 (high of 04/06/09)
Support: $65.92 (low of 04/06/09) Resistance: $68.95 (yesterday's high)
OIL (BRENT):
Support: $66.88 (yesterday's low) Resistance: $70.15 (high of 16/10/08)
Support: $65.49 (low of 01/06/09) Resistance: $69.91 (high of 05/06/09)
Support: $64.91 (low of 03/06/09) Resistance: $68.79 (yesterday's high)