This thread is solely for the Trading Journal of the "Key Trading Method Made Simple"
don't complicate things with the indis/oscis, colors, ea's you've seen on every chart.
(Technical & Price Action Trading Style).
Strategy Description:
~TMA Blue, Divergence Bar Blue, Buy.
~TMA Red, Divergence Bar Red, Sell.
~Take Caution for Divergences when:
TMA Blue, Divergence Bar Red - Bearish Divergence.
TMA Red, Divergence Bar Blue - Bullish Divergence.
with ADR, Inside Bar Candle, RSI Average Level Signals, T3 MA,
and Inverse Psychology Oscillator Reversal Signals.
Investor's Password: X5NH%?Nb^Yn^
Login: 20129309
There's only two things that we should know, price will go up and eventually price will go down. or simply the price will go up and down.
Selected and upgraded and updated modified indicators/oscillators are truly committed with their works as programmed based on history facts.
History is the past, without it there's no present nor future.
Allow me to introduce the selected indis/oscis,
from the collections and the top 100 best of the best indicators/oscillators
proven and back tested with the result as 3rd place in the demo contest.
// the upgraded and modified versions ---
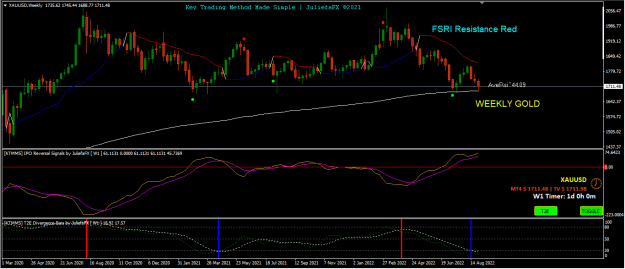
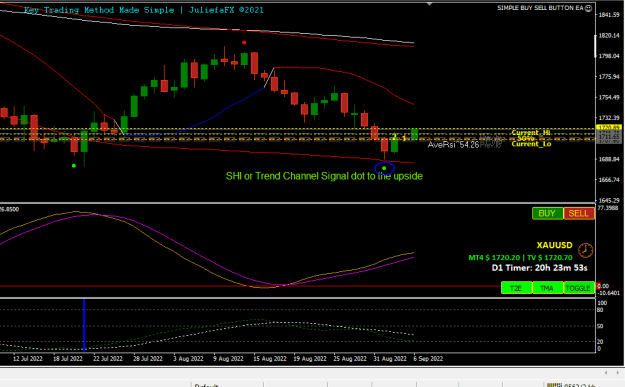
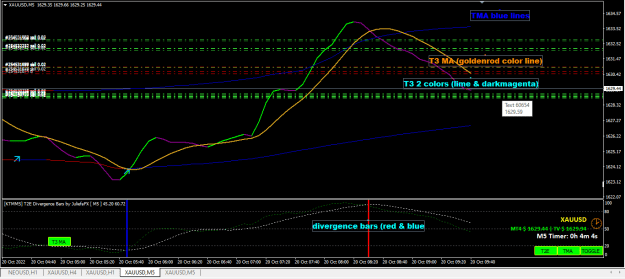
1. TMA or Triangular Moving Average, 'TMA TREND and DAILY HIGH LOW wButton', a 4 in 1 indicator with daily high low previous and current, with candle type 1-2-3 from theSTRAT by rob smith, and days of week. view chart for the upgraded modified version of TMA (https://www.cryptocraft.com/thread/post/14234980#post14234980) <--- added to this version is the 'divergence bars', it's now 5 in 1 indicator.
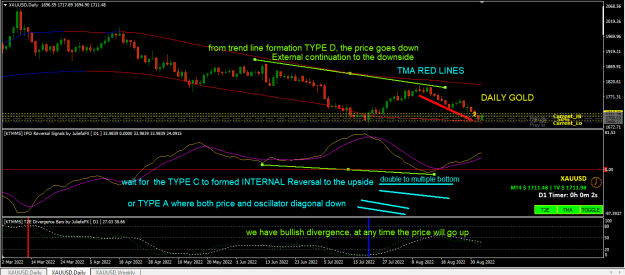
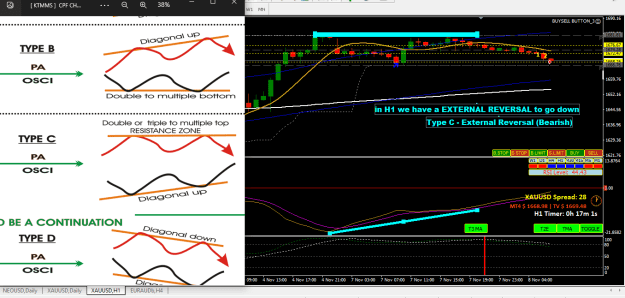
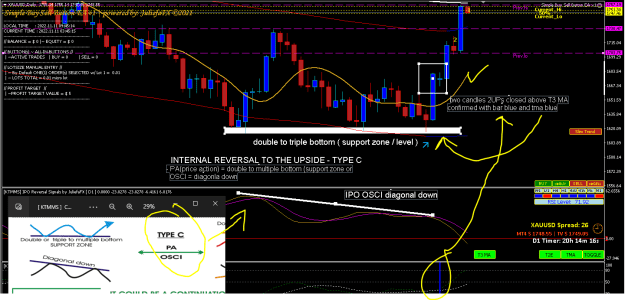
2. '[KTMMS] IPO Reversal Signals' or Inverse Psychology Oscillator, an oscillator that gives a signals with price action in which you can draw a lines internally and externally to identify reversals. click here to see chart 'Trend Line Formation Cheat Sheet (https://docs.google.com/document/d/1PCCDWFl-gwMI3CJHLMP4q3Yw32tE2Achp-mLERM2bT4/edit#bookmark=id.7yj10xr3yix3)
3. '[KTMMS] T2E Divergence Bars wButton', an oscillator for divergence and a ticket for entry and exit, and coded with candle timer, price, symbol, spread, and ADR.
4. 'T3 MA wButton', an indicator, a substitute to the #1 best 5 EMA TDI used by the late EELFranz.
Allow me to introduce and add this to your spices
the Method according to Rob Smith "the STRAT Method"
and the Method according to Elliott Waves "the Elliot's Wave Theory"
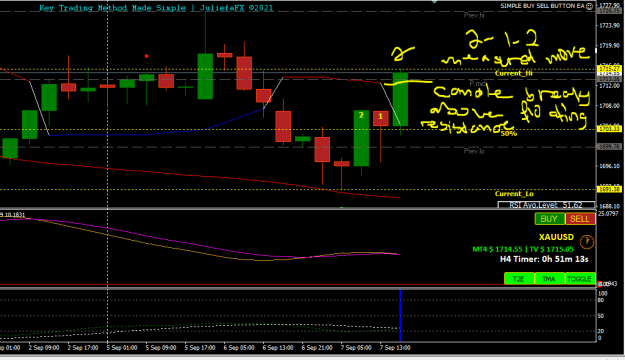
For Price Action, method used by Rob Smith - The STRAT to identify the next move, the next ' 2 ' candle, which is the directional candle.
- Type of Candles
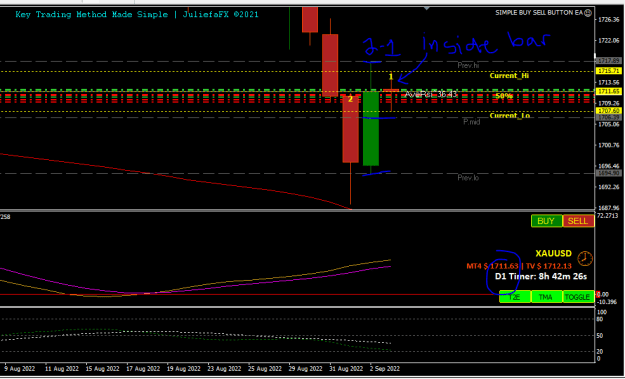
> Type 1 = Inside Bar
> Type 2 = Directional Bar
> Type 3 = Outside Bar
- Broadening Formations
- FTFC or full time frame continuity, for bull market (M,W,D,H1 bullish)
allow me to share these indis. uploaded 26/11/2022
I hope you find this indi helpful and useful.
STRAT BAR TYPE ~
Slim STRAT Bar Type ~
simple things and the easiest way to remember before placing your trades:
//this is when to place orders
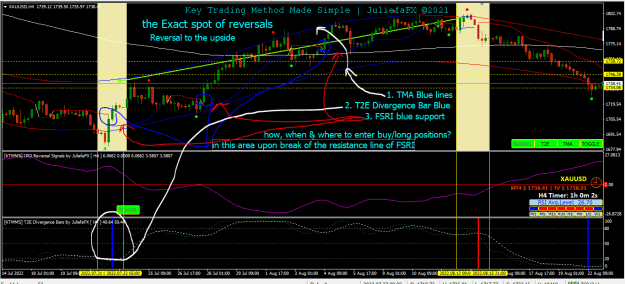
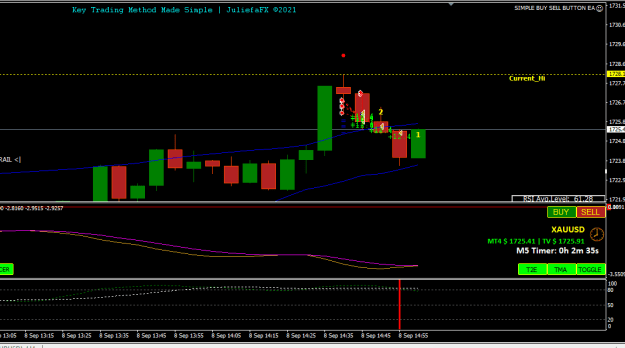
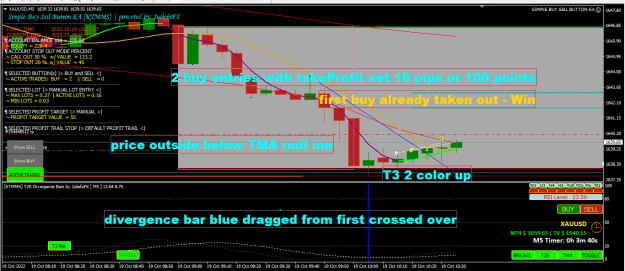
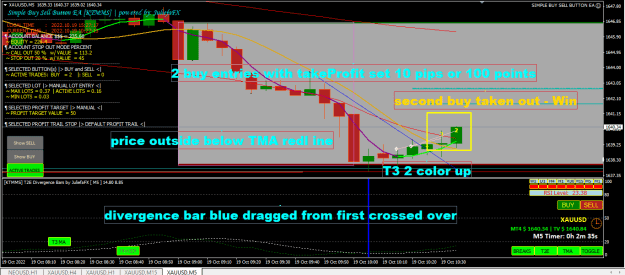
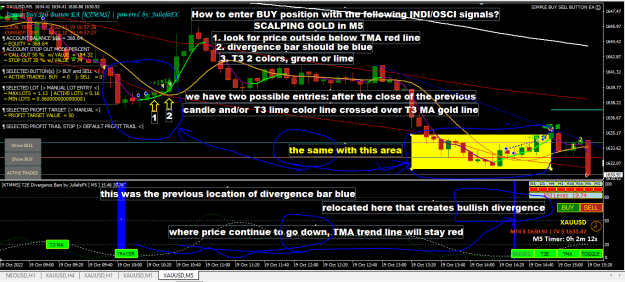
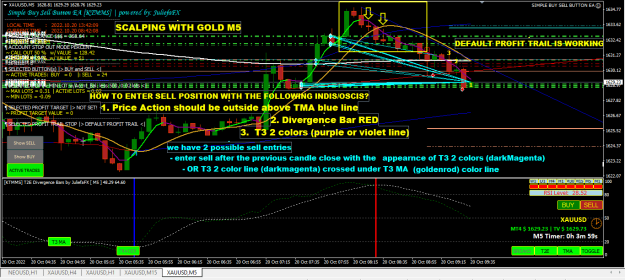
1. Indicators: TMA and T2E Divergence Bars ( TMA blue lines, T2E Divergence Bar blue -> BUY || TMA red lines, T2E Divergence Bar red -> SELL)
FOR SELL
> if price go outside above TMA blue line and turns red after a few candles with the appearance of Divergence Bar red, you take short or sell (add T3 MA for additional confirmation)
FOR BUY
> if price go outside below TMA red line and turns blue after a few candles with the appearance of Divergence Bar blue, you take long or buy. (add T3 MA for additional confirmation)
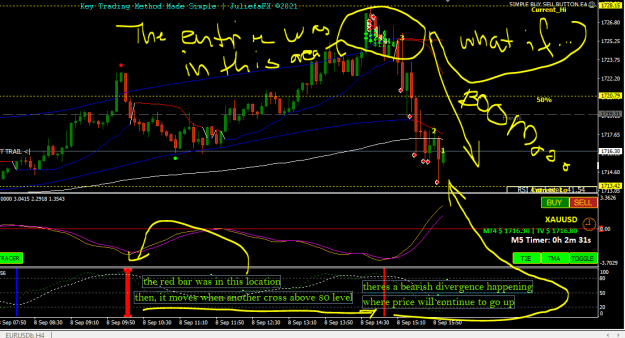
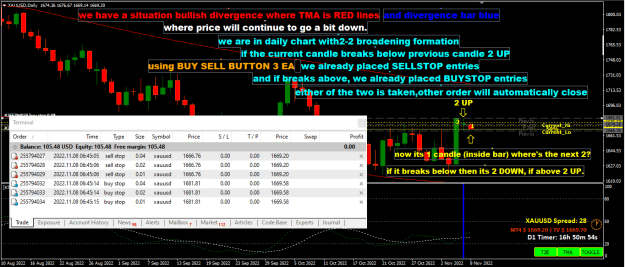
a. if price go outside above TMA blue line, and TMA blue lines and Divergence bar red, take extra caution to execute short or sell because a bearish divergence is happening where price will continue to go up. one or two or more connecting points (higher lows) before reversal commences to the downside.
b. if price go outside below TMA red line, and TMA red lines and Divergence bar blue, take extra caution to execute long or buy because a bullish divergence is happening where price will continue to go down. one or two or more connecting points (lower lows) before reversal commences to the upside.
note: the above a. and b. can be monitored with the use of the IPO Reversal Signals Oscillator with Price Action. click here to see chart (https://docs.google.com/document/d/1PCCDWFl-gwMI3CJHLMP4q3Yw32tE2Achp-mLERM2bT4/edit#bookmark=id.erckjh5b1es9)
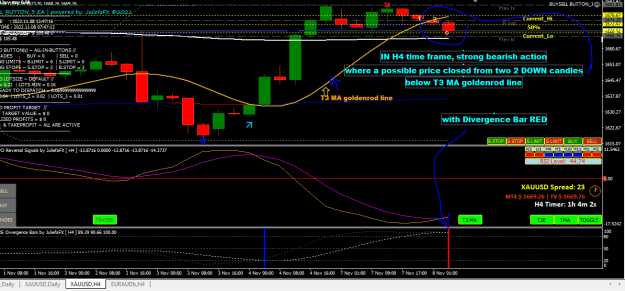
Indicator: to add the lines of useful indicator to get a concrete confirmation is the 'T3 MA',
//this is where to place orders
FOR SELL
> if two candles closed above T3 MA line both directional candle 'type 2' or 2UPs, if this confirms the above signals of TMA and Divergence Bars, then you take long or buy.
FOR BUY
> if two candles closed below T3 MA line both directional candle 'type 2' or 2DOWNs, if this confirms the above signals of TMA and Divergence Bars, then you take long or buy.
OR you may use your own experimentation with these indis/oscis for your own convenience.
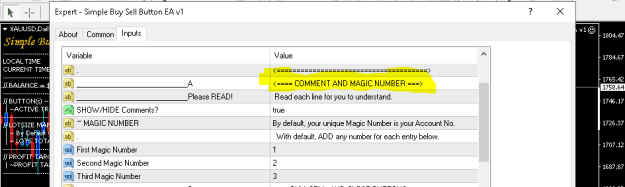
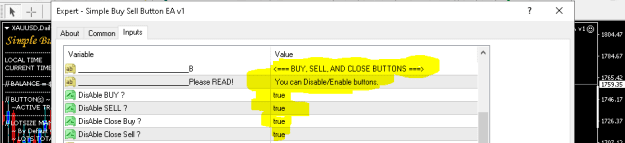
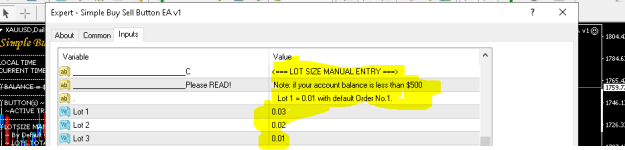
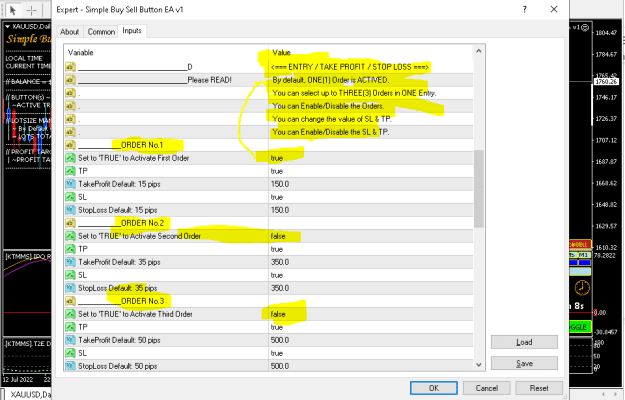
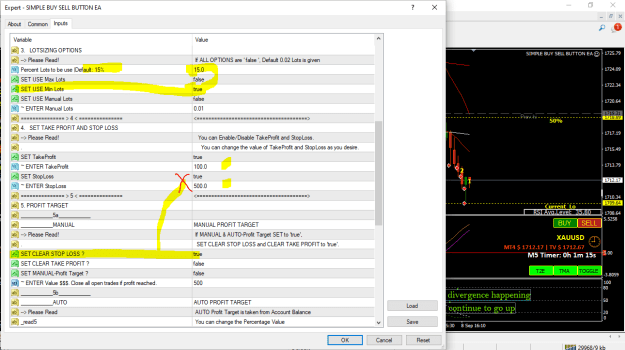
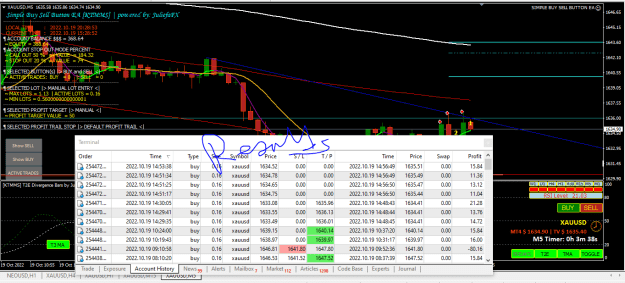
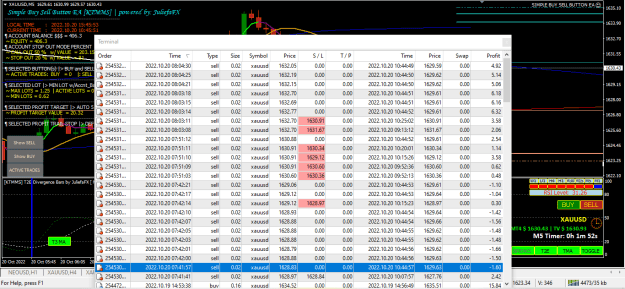
Together with, you may also try the Trading Manager Tool for manual trading, the 'Simple Buy Sell Button EA v1'
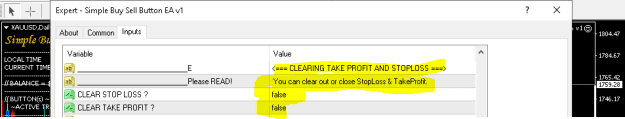
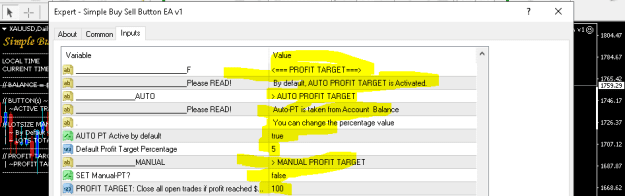
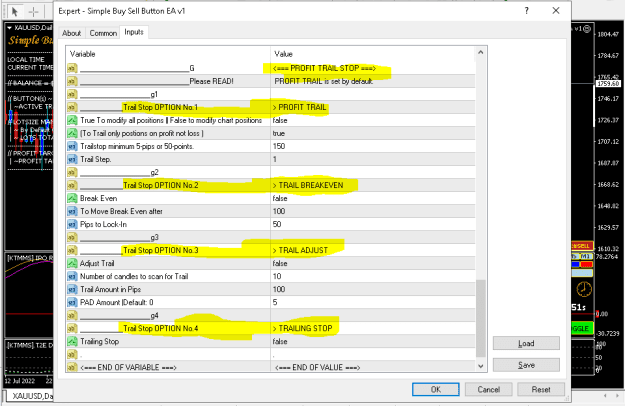
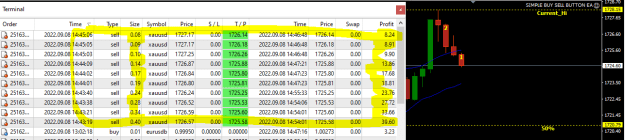
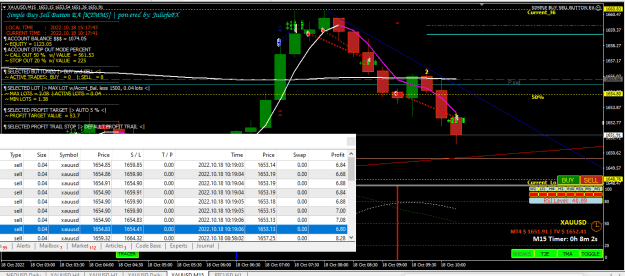
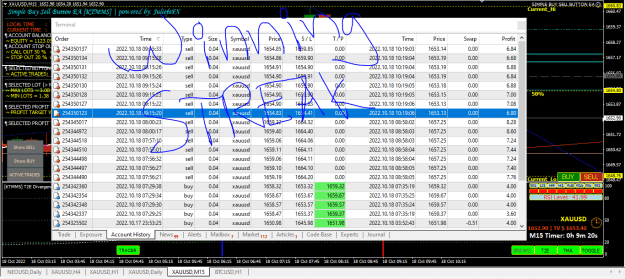
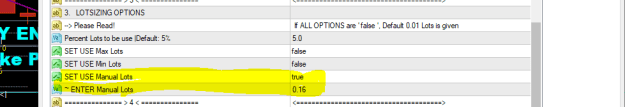
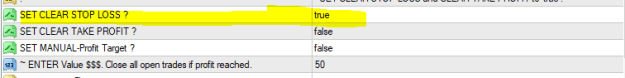
'Simple Buy Sell Button EA v1' > is an Expert Advisor, a forex robot, a Trading Manager Tool with functions conditions by mathematical algorithms that runs continuously NOT TO MAKE TRADES or PLACE ORDERS or ENTRIES automatically, but to calculate and manage entry for lot size, stop loss and take profit, auto profit target value $, auto profit trail, with break even, advance trail, and trailing stop, and with entries or orders or trades can be done by the use of Buy & Sell Buttons. In other words, entries or orders or trades be executed MANUALLY with a push of a 'button'.
To read more about this trading system, click here (https://docs.google.com/document/d/1PCCDWFl-gwMI3CJHLMP4q3Yw32tE2Achp-mLERM2bT4/edit?usp=sharing)
All of which can be applied for Scalping, Swing, or Long Position Trading.
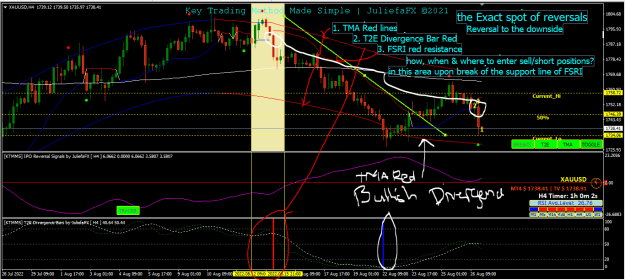
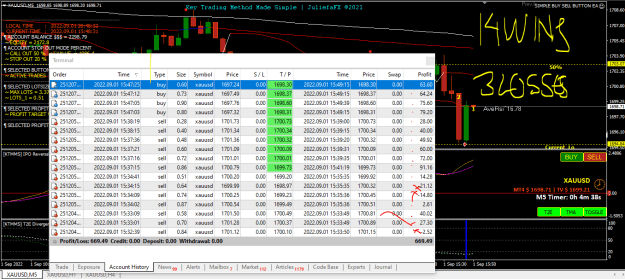
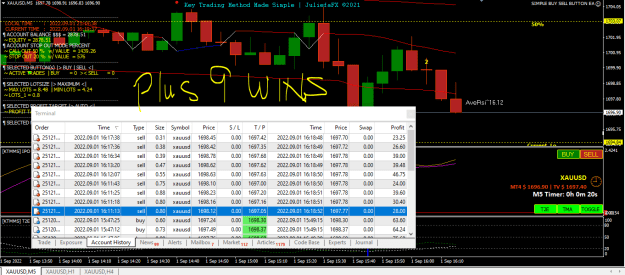
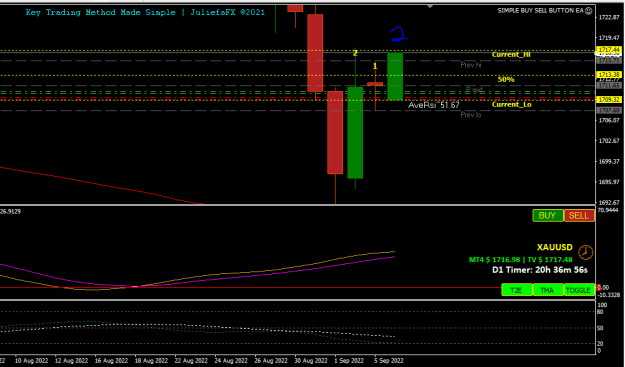
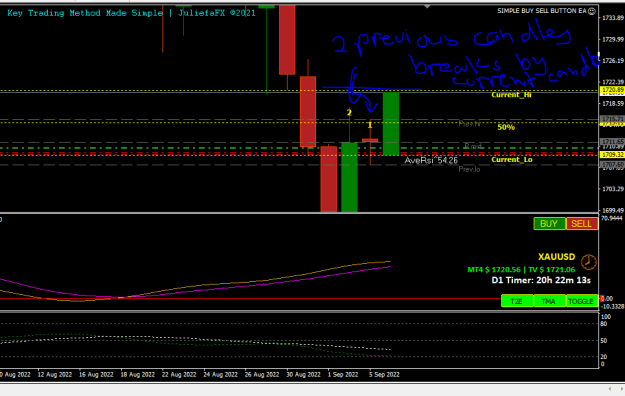
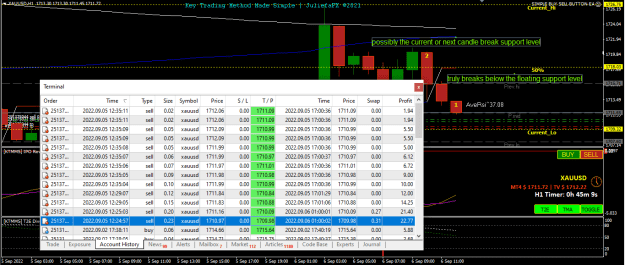
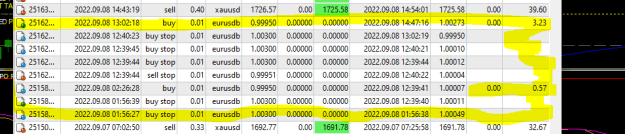
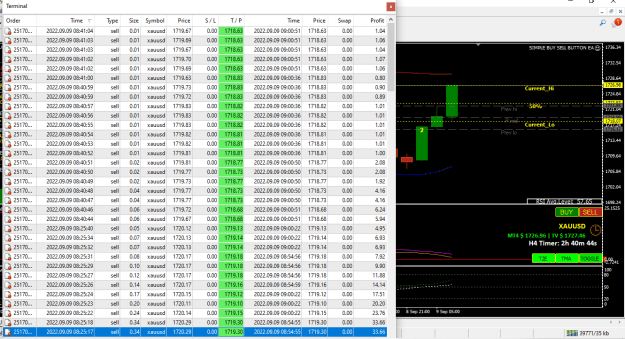
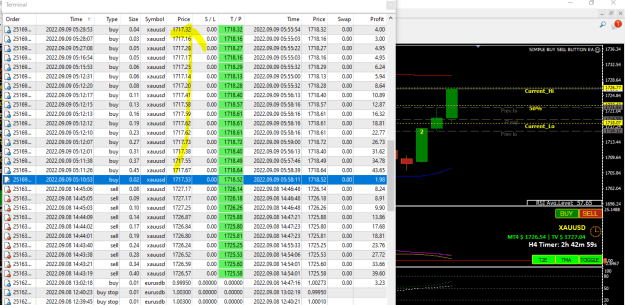
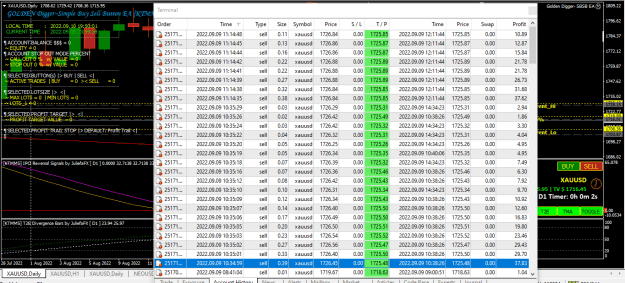
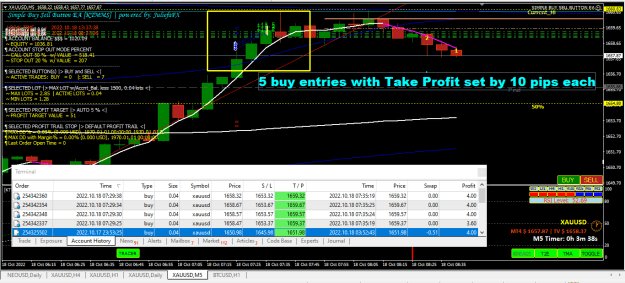
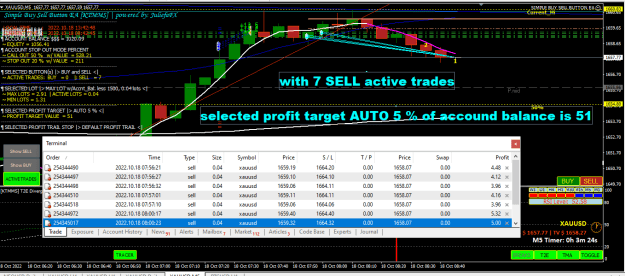
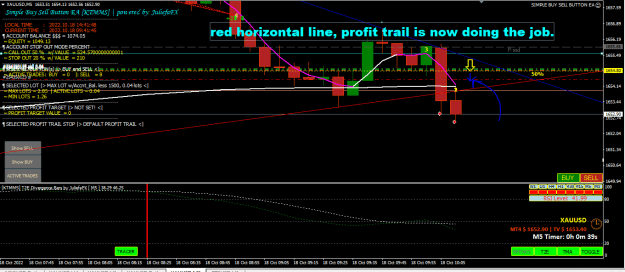
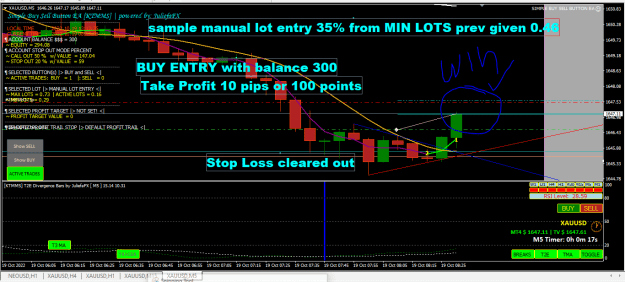
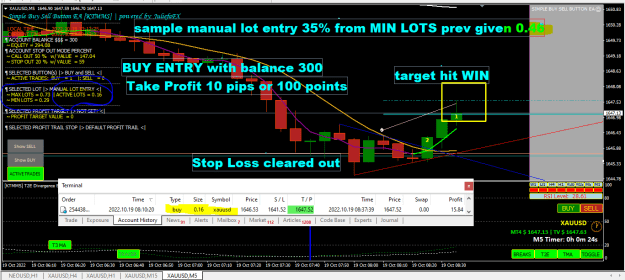
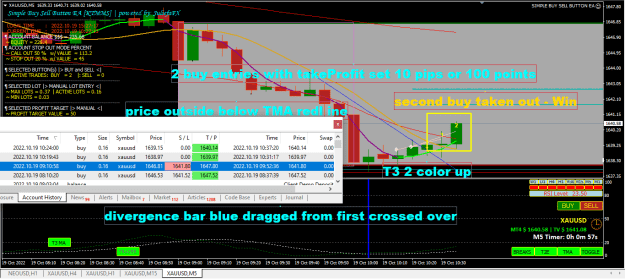
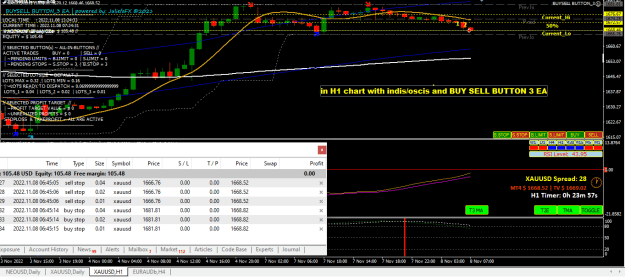
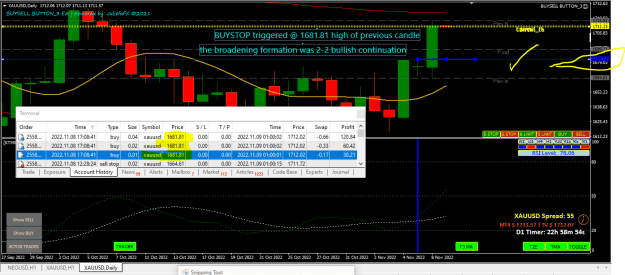
SAMPLE CHART : indis/oscis: TMA, T2E DIVERGENCE BARS, IPO REVERSAL SIGNALS, T3 MA with Simple Buy Sell Button EA v1.
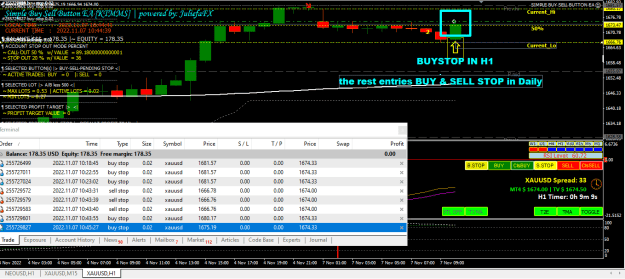
(OPTIONAL, but its a must) order(s) to be executed.
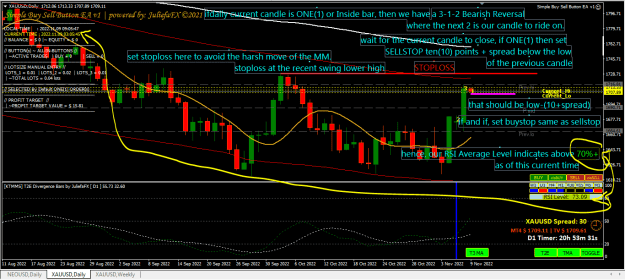
>PENDING BUYSTOP = 10 points above previous high candle( second candle 2 up closed above T3 MA), and comes.. where's the NEXT 2? the next 2 is to be determined. Hence, we have signals from TMA, DIVERGENCE BAR, and IPO Reversal Signals (OSCI) with Price Action (PA), with final confirmation from T3 MA, and it's CONFIRMED.
STOPLOSS set at T3 MA line.
TAKE PROFIT options:
1. take profit set 1:2 or 1:3 or more..
2. take profit by AUTO Profit Target Value$ of given input percentage.
3. open profit target and close at the appearance of divergence bar or price outside above or below TMA lines. but it's all up to you. just don't be greedy. (dont worry you have profit trail stop auto set - nothing to lose just breakeven)
4. open profit target and close or exit trade when price retrace back and make a drawdown of 20%.
example: your balance = $1000, and gain a profit of $100, thats $1100 equity . $100 multiplied by 20% = $20, you gain a profit of $80.
May your pips come true. Happy Trading and have fun.
Your Success is what matters most.
Master it!
click here to Read more... (https://docs.google.com/document/d/1PCCDWFl-gwMI3CJHLMP4q3Yw32tE2Achp-mLERM2bT4/edit?usp=sharing)
Disclaimer:
JuliefaFX Technical Analysis, including autochartist services and contents, is provided for informational purposes only, and does not take into account any individual's personal circumstances, investment objectives, or risk tolerance. Past performance is not indicative of future results.
Please conduct your own due diligence and make your trades cautiously before relying on this information, and should verify the nature of any product or service, including its legal status and relevant regulatory requirements, and consult the relevant regulators before making any action or decision.
All rights reserved. The use of this method constitutes acceptance of our user agreement.
don't complicate things with the indis/oscis, colors, ea's you've seen on every chart.
(Technical & Price Action Trading Style).
Strategy Description:
~TMA Blue, Divergence Bar Blue, Buy.
~TMA Red, Divergence Bar Red, Sell.
~Take Caution for Divergences when:
TMA Blue, Divergence Bar Red - Bearish Divergence.
TMA Red, Divergence Bar Blue - Bullish Divergence.
with ADR, Inside Bar Candle, RSI Average Level Signals, T3 MA,
and Inverse Psychology Oscillator Reversal Signals.
Investor's Password: X5NH%?Nb^Yn^
Login: 20129309
There's only two things that we should know, price will go up and eventually price will go down. or simply the price will go up and down.
Selected and upgraded and updated modified indicators/oscillators are truly committed with their works as programmed based on history facts.
History is the past, without it there's no present nor future.
Allow me to introduce the selected indis/oscis,
from the collections and the top 100 best of the best indicators/oscillators
proven and back tested with the result as 3rd place in the demo contest.
// the upgraded and modified versions ---
1. TMA or Triangular Moving Average, 'TMA TREND and DAILY HIGH LOW wButton', a 4 in 1 indicator with daily high low previous and current, with candle type 1-2-3 from theSTRAT by rob smith, and days of week. view chart for the upgraded modified version of TMA (https://www.cryptocraft.com/thread/post/14234980#post14234980) <--- added to this version is the 'divergence bars', it's now 5 in 1 indicator.
2. '[KTMMS] IPO Reversal Signals' or Inverse Psychology Oscillator, an oscillator that gives a signals with price action in which you can draw a lines internally and externally to identify reversals. click here to see chart 'Trend Line Formation Cheat Sheet (https://docs.google.com/document/d/1PCCDWFl-gwMI3CJHLMP4q3Yw32tE2Achp-mLERM2bT4/edit#bookmark=id.7yj10xr3yix3)
3. '[KTMMS] T2E Divergence Bars wButton', an oscillator for divergence and a ticket for entry and exit, and coded with candle timer, price, symbol, spread, and ADR.
4. 'T3 MA wButton', an indicator, a substitute to the #1 best 5 EMA TDI used by the late EELFranz.
Allow me to introduce and add this to your spices
the Method according to Rob Smith "the STRAT Method"
and the Method according to Elliott Waves "the Elliot's Wave Theory"
For Price Action, method used by Rob Smith - The STRAT to identify the next move, the next ' 2 ' candle, which is the directional candle.
- Type of Candles
> Type 1 = Inside Bar
> Type 2 = Directional Bar
> Type 3 = Outside Bar
- Broadening Formations
- FTFC or full time frame continuity, for bull market (M,W,D,H1 bullish)
allow me to share these indis. uploaded 26/11/2022
I hope you find this indi helpful and useful.
STRAT BAR TYPE ~
Attached File(s)
Slim STRAT Bar Type ~
Attached File(s)
simple things and the easiest way to remember before placing your trades:
//this is when to place orders
1. Indicators: TMA and T2E Divergence Bars ( TMA blue lines, T2E Divergence Bar blue -> BUY || TMA red lines, T2E Divergence Bar red -> SELL)
FOR SELL
> if price go outside above TMA blue line and turns red after a few candles with the appearance of Divergence Bar red, you take short or sell (add T3 MA for additional confirmation)
FOR BUY
> if price go outside below TMA red line and turns blue after a few candles with the appearance of Divergence Bar blue, you take long or buy. (add T3 MA for additional confirmation)
a. if price go outside above TMA blue line, and TMA blue lines and Divergence bar red, take extra caution to execute short or sell because a bearish divergence is happening where price will continue to go up. one or two or more connecting points (higher lows) before reversal commences to the downside.
b. if price go outside below TMA red line, and TMA red lines and Divergence bar blue, take extra caution to execute long or buy because a bullish divergence is happening where price will continue to go down. one or two or more connecting points (lower lows) before reversal commences to the upside.
note: the above a. and b. can be monitored with the use of the IPO Reversal Signals Oscillator with Price Action. click here to see chart (https://docs.google.com/document/d/1PCCDWFl-gwMI3CJHLMP4q3Yw32tE2Achp-mLERM2bT4/edit#bookmark=id.erckjh5b1es9)
Indicator: to add the lines of useful indicator to get a concrete confirmation is the 'T3 MA',
//this is where to place orders
FOR SELL
> if two candles closed above T3 MA line both directional candle 'type 2' or 2UPs, if this confirms the above signals of TMA and Divergence Bars, then you take long or buy.
FOR BUY
> if two candles closed below T3 MA line both directional candle 'type 2' or 2DOWNs, if this confirms the above signals of TMA and Divergence Bars, then you take long or buy.
OR you may use your own experimentation with these indis/oscis for your own convenience.
Together with, you may also try the Trading Manager Tool for manual trading, the 'Simple Buy Sell Button EA v1'
'Simple Buy Sell Button EA v1' > is an Expert Advisor, a forex robot, a Trading Manager Tool with functions conditions by mathematical algorithms that runs continuously NOT TO MAKE TRADES or PLACE ORDERS or ENTRIES automatically, but to calculate and manage entry for lot size, stop loss and take profit, auto profit target value $, auto profit trail, with break even, advance trail, and trailing stop, and with entries or orders or trades can be done by the use of Buy & Sell Buttons. In other words, entries or orders or trades be executed MANUALLY with a push of a 'button'.
To read more about this trading system, click here (https://docs.google.com/document/d/1PCCDWFl-gwMI3CJHLMP4q3Yw32tE2Achp-mLERM2bT4/edit?usp=sharing)
All of which can be applied for Scalping, Swing, or Long Position Trading.
SAMPLE CHART : indis/oscis: TMA, T2E DIVERGENCE BARS, IPO REVERSAL SIGNALS, T3 MA with Simple Buy Sell Button EA v1.
(OPTIONAL, but its a must) order(s) to be executed.
>PENDING BUYSTOP = 10 points above previous high candle( second candle 2 up closed above T3 MA), and comes.. where's the NEXT 2? the next 2 is to be determined. Hence, we have signals from TMA, DIVERGENCE BAR, and IPO Reversal Signals (OSCI) with Price Action (PA), with final confirmation from T3 MA, and it's CONFIRMED.
STOPLOSS set at T3 MA line.
TAKE PROFIT options:
1. take profit set 1:2 or 1:3 or more..
2. take profit by AUTO Profit Target Value$ of given input percentage.
3. open profit target and close at the appearance of divergence bar or price outside above or below TMA lines. but it's all up to you. just don't be greedy. (dont worry you have profit trail stop auto set - nothing to lose just breakeven)
4. open profit target and close or exit trade when price retrace back and make a drawdown of 20%.
example: your balance = $1000, and gain a profit of $100, thats $1100 equity . $100 multiplied by 20% = $20, you gain a profit of $80.
Attached Image (click to enlarge)
May your pips come true. Happy Trading and have fun.
Your Success is what matters most.
Master it!
click here to Read more... (https://docs.google.com/document/d/1PCCDWFl-gwMI3CJHLMP4q3Yw32tE2Achp-mLERM2bT4/edit?usp=sharing)
Disclaimer:
JuliefaFX Technical Analysis, including autochartist services and contents, is provided for informational purposes only, and does not take into account any individual's personal circumstances, investment objectives, or risk tolerance. Past performance is not indicative of future results.
Please conduct your own due diligence and make your trades cautiously before relying on this information, and should verify the nature of any product or service, including its legal status and relevant regulatory requirements, and consult the relevant regulators before making any action or decision.
All rights reserved. The use of this method constitutes acceptance of our user agreement.
Attached Image(s) (click to enlarge)