https://www.forexfactory.com/thread/post/14330334
NEW CUMULATIVE DELTA PRICE VOLUME STRATEGY
I've updated this theory and trading strategy. Check out the new thread, many improvement to this strategy.
This is the result of testing this indicator for many years and my best recommendation towards a profitable trading strategy. I've been trading financial markets for 15+ years and tried almost everything. It's also a continuation of many previous threads involving this trading theory and philosophy. It's advanced how the indicator works and I might be sharing some background info later, but most important is how to trade it and that is described below where I tried to make it as simple as possible.
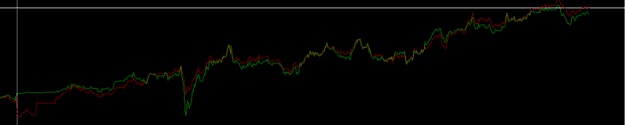
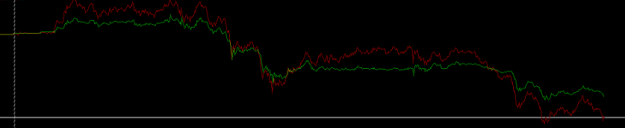
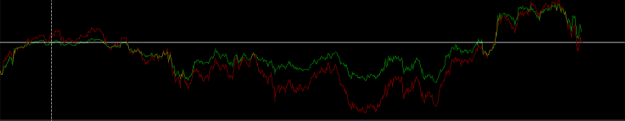
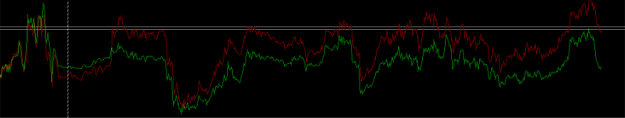
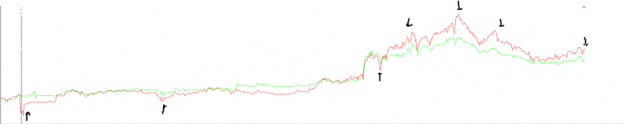
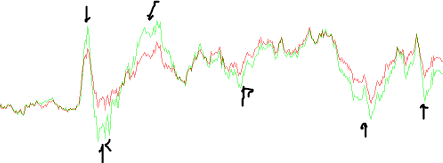
Attached in new thread: Random charts from different time frames explaining and showing clear and strong trade signals. It's simple, trade it when red price does not follow green volume. Give it a try and good luck
HOW TO TRADE
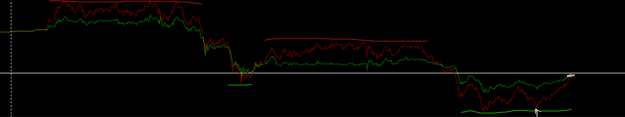
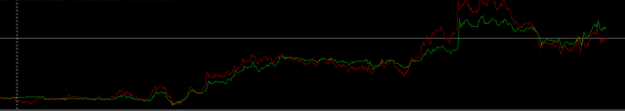
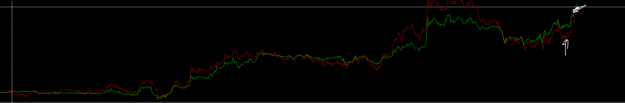
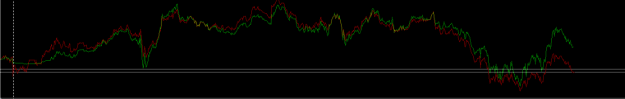
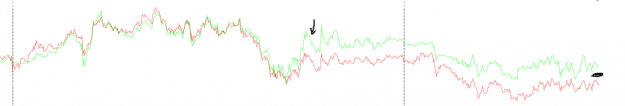
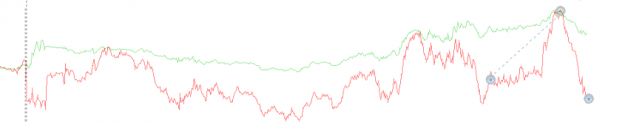
1. Price lines are red and volume lines are green
2. Compare the lines
3. Assume both red price and green volume should follow each other and notice differences
4. Analyze when red price moves away from volume and does not follow green volume
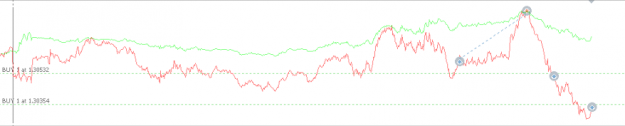
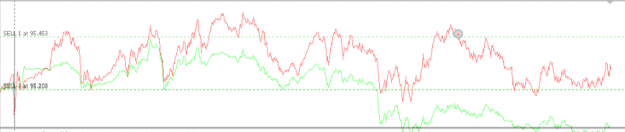
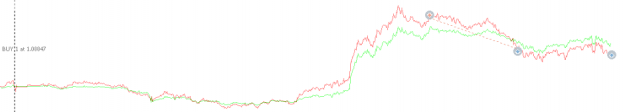
5. Trade the difference if both gap but most importantly the ratio of difference is big, for example if red price makes a move at least double in size, the bigger the difference the better trading opportunity. When red price makes significant move or gap both more volatile and higher ratio difference and lines below green, buy. When red price makes significant move or gap both more volatile and higher ratio difference and lines above green, sell. The bigger the ratio and length of difference, the higher probability of profitability (examples shown in later posts)
6. All timeframes and markets available in your Metatrader can be used and I recommend matching trade opportunities when signal is strong on more timeframes. Data is different for all brokers, so after you learn how to trade, data can be compared and overlayed on many different brokers for confirmation.
Indicator and template can be found in new thread. Hope you enjoy the progress and update in strategy.
https://www.forexfactory.com/thread/post/14330334
---------------------------------------------------------------------------------------------------------------------------------------------------------------------------------------
Price/Volume strategy (only works on mt5) - steps for indicator installment:
MT5
https://www.mql5.com/en/market/produ...Profile+Seller
1. Go through link or go to mql marketplace and search for 'cumulative delta'
2. Install to your metatrader
3. Download attached template and copy it into your metatrader 'files' > 'open data map' in metatrader (ctrl+shift+D) go to 'MQL5' > 'profiles > 'templates' and put template into this map then restart metatrader
4. Right click on chart in metatrader and go 'templates' and load 'pricevolumemt5'
Credit and thanks to Evgeny Shevtsov
---------------------------------------------------------------------------------------------------------------------------------------------------------------------------------------
How to trade
1. Find a precise volume data or indicator
2. Compare with price of an asset
3. Assume both should follow each other and notice differences
4. Analyze which of the two makes the gap
5. Trade the difference in the flows of price and volume
Price line pink - Volume line black
What makes the best trade entries?
Pink price trades: Pink pulls/drags away from black, being more volatile and making gap. The bigger the ratio and length of difference, the higher probability.
Black volume trades: Black pulls/drags away from pink, being more volatile and making gap. The bigger the ratio and length of difference, the higher probability.
NEW CUMULATIVE DELTA PRICE VOLUME STRATEGY
I've updated this theory and trading strategy. Check out the new thread, many improvement to this strategy.
This is the result of testing this indicator for many years and my best recommendation towards a profitable trading strategy. I've been trading financial markets for 15+ years and tried almost everything. It's also a continuation of many previous threads involving this trading theory and philosophy. It's advanced how the indicator works and I might be sharing some background info later, but most important is how to trade it and that is described below where I tried to make it as simple as possible.
Attached in new thread: Random charts from different time frames explaining and showing clear and strong trade signals. It's simple, trade it when red price does not follow green volume. Give it a try and good luck
HOW TO TRADE
1. Price lines are red and volume lines are green
2. Compare the lines
3. Assume both red price and green volume should follow each other and notice differences
4. Analyze when red price moves away from volume and does not follow green volume
5. Trade the difference if both gap but most importantly the ratio of difference is big, for example if red price makes a move at least double in size, the bigger the difference the better trading opportunity. When red price makes significant move or gap both more volatile and higher ratio difference and lines below green, buy. When red price makes significant move or gap both more volatile and higher ratio difference and lines above green, sell. The bigger the ratio and length of difference, the higher probability of profitability (examples shown in later posts)
6. All timeframes and markets available in your Metatrader can be used and I recommend matching trade opportunities when signal is strong on more timeframes. Data is different for all brokers, so after you learn how to trade, data can be compared and overlayed on many different brokers for confirmation.
Indicator and template can be found in new thread. Hope you enjoy the progress and update in strategy.
https://www.forexfactory.com/thread/post/14330334
---------------------------------------------------------------------------------------------------------------------------------------------------------------------------------------
Price/Volume strategy (only works on mt5) - steps for indicator installment:
MT5
https://www.mql5.com/en/market/produ...Profile+Seller
1. Go through link or go to mql marketplace and search for 'cumulative delta'
2. Install to your metatrader
3. Download attached template and copy it into your metatrader 'files' > 'open data map' in metatrader (ctrl+shift+D) go to 'MQL5' > 'profiles > 'templates' and put template into this map then restart metatrader
4. Right click on chart in metatrader and go 'templates' and load 'pricevolumemt5'
Credit and thanks to Evgeny Shevtsov
---------------------------------------------------------------------------------------------------------------------------------------------------------------------------------------
How to trade
1. Find a precise volume data or indicator
2. Compare with price of an asset
3. Assume both should follow each other and notice differences
4. Analyze which of the two makes the gap
5. Trade the difference in the flows of price and volume
Price line pink - Volume line black
What makes the best trade entries?
Pink price trades: Pink pulls/drags away from black, being more volatile and making gap. The bigger the ratio and length of difference, the higher probability.
Black volume trades: Black pulls/drags away from pink, being more volatile and making gap. The bigger the ratio and length of difference, the higher probability.
Attached File(s)