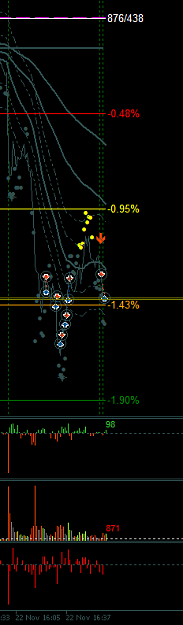
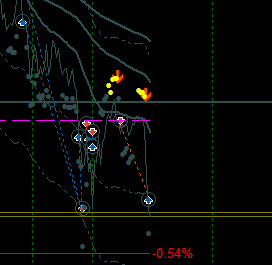
One small GU short taken +1.15%
Should wait more, on H4 the picture was clear, but the volume was low, so I have decided to quit as soon as possible
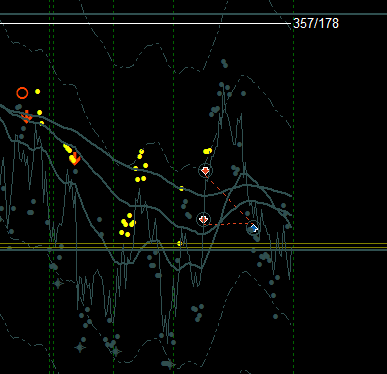
Since this thread is sometimes education I was to say few words about indicators I'm using in my trading.
Moving average. A lot of people say that it is lagging. But it is not. It shows exactly what you want - average price for X candles back. It can be close price, open, high, low or even median. You can smooth your results or use simple version. Moving average is base indicator. It is very useful for several purposes. Also if you want to see average price of 50 from 1H tf on your 1m TF, then just multiply it on 60. So 3000 EMA on 1m equals 50 EMA on 1H tf. Moving average is very clear and powerful indicator.
I'm using MA for this:
1. To determine the trend. I'm using 3 MA at once (and sometimes 20 MAs at once) to check the picture.
2. To draw envelopes.
3. To set limit orders (add more to position) and/or using it as SL/TP
4. To check angle and distance between. It help to found "speed" of market.
Stochastic. Most people don't understand but stochastic is about the same like moving average but just represented as oscillator. If moving average has no top or bottom and even can be negative, stochastic has the channel 0-100 and its value limited to that channel.
I'm using stochastic for entry and exit purposes. Especially for exit. It is very powerful indicator because of its nature. BTW you can use RSI, it is very similar. But Stoch is better for algo trading because it has 2 lines, so there are much more variants can be found. But beware scam articles and videos where people say that Stoch (RSI) and other oscillator can show oversold and overbought areas. They can't. Stoch has no volume data used it its formula.
UPD:
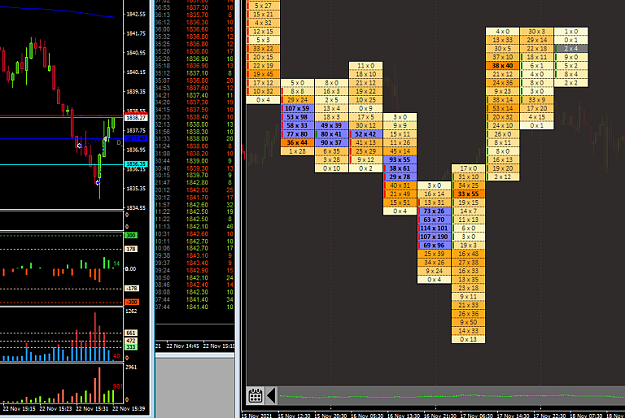
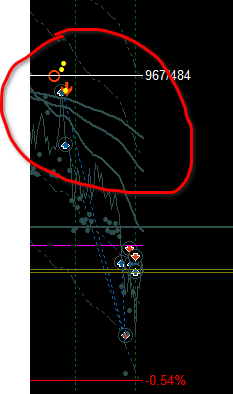
XAU short +1.67%
That was classic "indicator" trade.
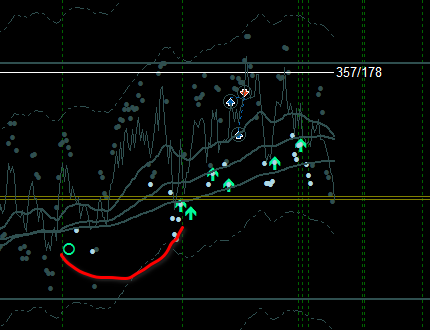
1. It was MA order for short (red circle). Mean that all 3 moving averages are in correct order and the distance between them are good too. Also there was cross behind.
2. It is Stoch found, it found at correct place (distance from MA).
3. The arrow appear (secret sauce), it also filtered by the trend.
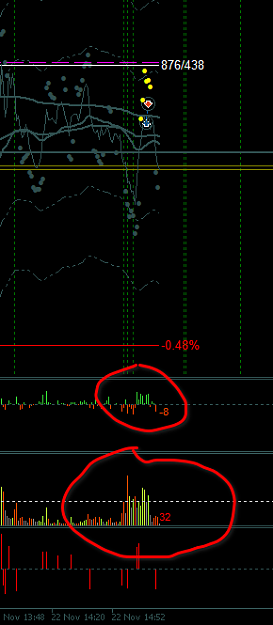
4. Low volume (not good)
5. Green delta (good).
6. Main trend on 1H is down.
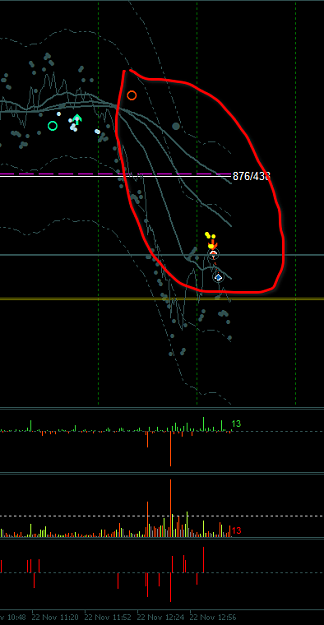
So this I call AAAAA-setup (5 five A). Best is six A, but 5A also good in most cases.
Attached Image
Should wait more, on H4 the picture was clear, but the volume was low, so I have decided to quit as soon as possible
Attached Image (click to enlarge)
Since this thread is sometimes education I was to say few words about indicators I'm using in my trading.
Moving average. A lot of people say that it is lagging. But it is not. It shows exactly what you want - average price for X candles back. It can be close price, open, high, low or even median. You can smooth your results or use simple version. Moving average is base indicator. It is very useful for several purposes. Also if you want to see average price of 50 from 1H tf on your 1m TF, then just multiply it on 60. So 3000 EMA on 1m equals 50 EMA on 1H tf. Moving average is very clear and powerful indicator.
I'm using MA for this:
1. To determine the trend. I'm using 3 MA at once (and sometimes 20 MAs at once) to check the picture.
2. To draw envelopes.
3. To set limit orders (add more to position) and/or using it as SL/TP
4. To check angle and distance between. It help to found "speed" of market.
Stochastic. Most people don't understand but stochastic is about the same like moving average but just represented as oscillator. If moving average has no top or bottom and even can be negative, stochastic has the channel 0-100 and its value limited to that channel.
I'm using stochastic for entry and exit purposes. Especially for exit. It is very powerful indicator because of its nature. BTW you can use RSI, it is very similar. But Stoch is better for algo trading because it has 2 lines, so there are much more variants can be found. But beware scam articles and videos where people say that Stoch (RSI) and other oscillator can show oversold and overbought areas. They can't. Stoch has no volume data used it its formula.
UPD:
XAU short +1.67%
That was classic "indicator" trade.
1. It was MA order for short (red circle). Mean that all 3 moving averages are in correct order and the distance between them are good too. Also there was cross behind.
2. It is Stoch found, it found at correct place (distance from MA).
3. The arrow appear (secret sauce), it also filtered by the trend.
4. Low volume (not good)
5. Green delta (good).
6. Main trend on 1H is down.
Attached Image (click to enlarge)
So this I call AAAAA-setup (5 five A). Best is six A, but 5A also good in most cases.
Observer effect
2