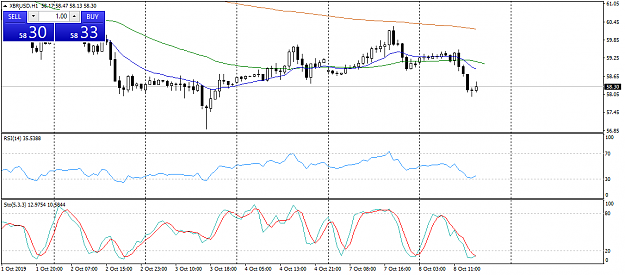
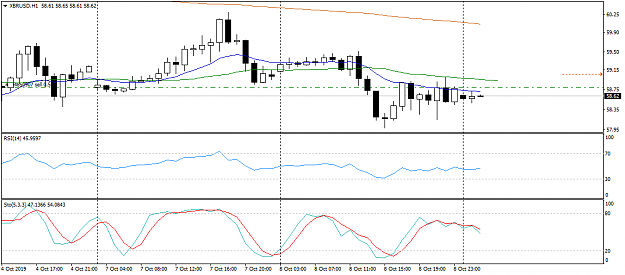
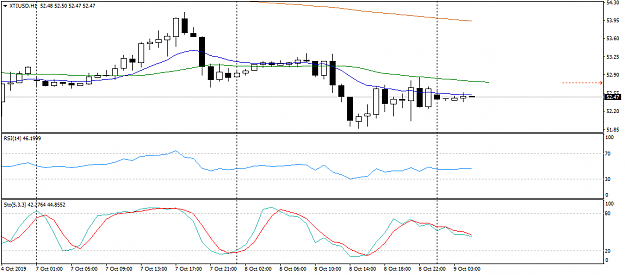
Hi Traders
Just thought id share something that i have been looking at on the H1 chart specifically trading Oil and Gas off of the H1 chart, It is a work in progress, but the results have been consistent enough for me to share it with whomever may be interested
This is a follow up on the 4+1 metals strategy i have been using and its use and functionality has seen us making use of the H1, H4, and D1 charts.
We will get a number of opportunities as this is on a lower time frame. Will look to use this specifically on the H1 chart for now and as time goes on may look at incorporating the H4 and D1 charts to it......
This is no Holy grail system, like anything else, you need to put in some time, understand what we doing, practice proper money management and trade management, if youre looking for a holy grail system, kindly stop reading NOW!!!!
From time to time, we will adjust and set new parameters as trading within itself is a dynamic thing, but the core fundamentals of the strategy will remain
The idea behind this strategy is to keep it as simplified as possible and use it for the intra day charts.
System settings include;
H1 Chart.
200 EMA (Brown).
50 EMA Shift 2 (Green).
15 EMA(Blue).
How does it work?
Sell Setups.......
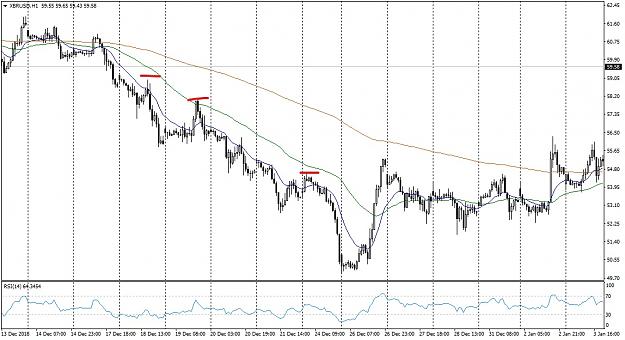
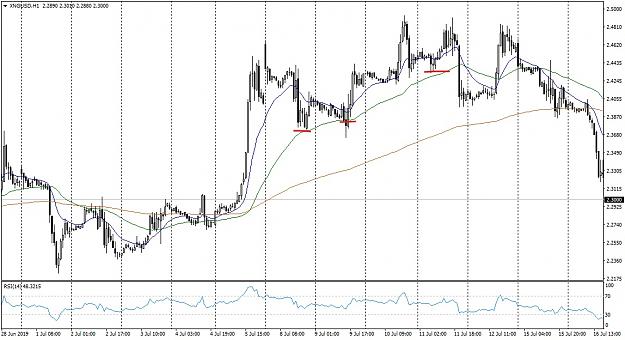
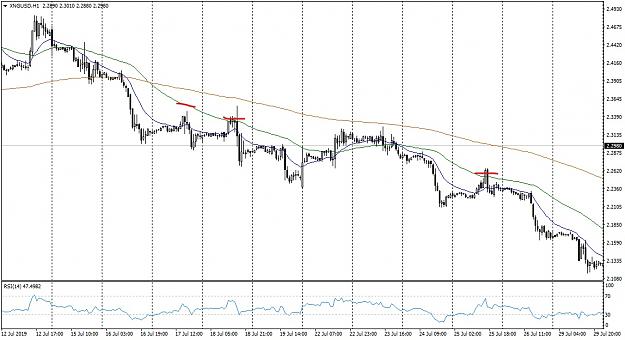
- 15 AND 50 ema BELOW 200 ema? We Look for short setups.
- To open a short position, the 15 EMA must be below the 50 EMA, when price touches or gets near the 50 EMA we look to short.
- We place our stop loss a couple of pips above the 200 EMA.
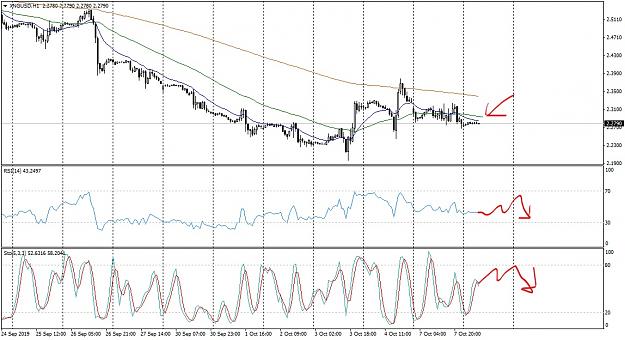
NB, if the 15 ema crosses back above 50 EMA but prices remain below the 200 EMA we stay out
Buy Setups.......
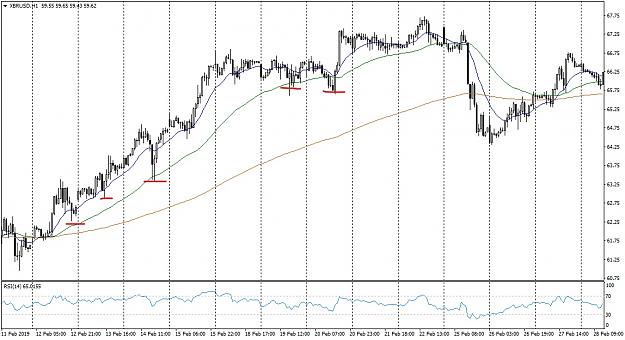
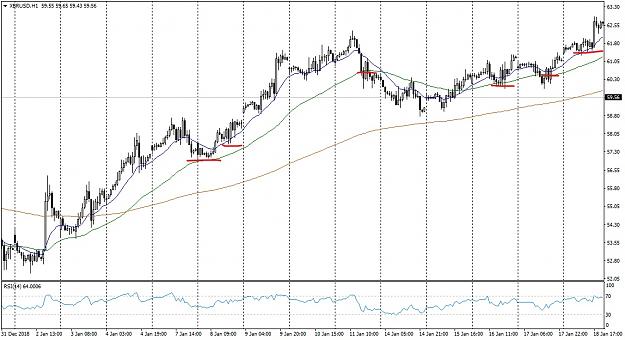
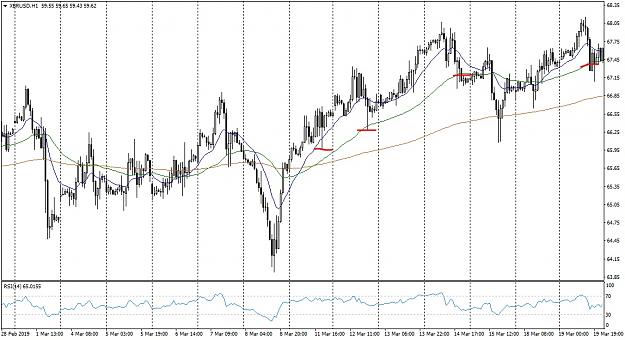
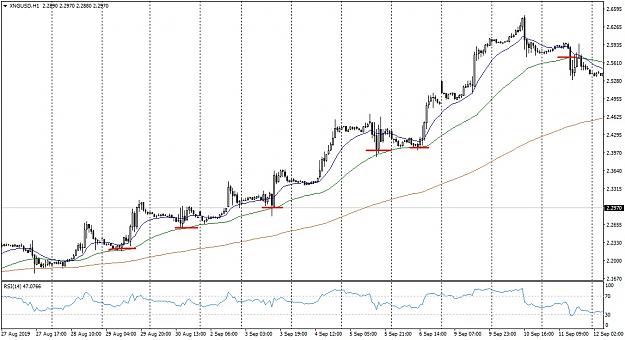
- 15 and 50 ema ABOVE the 200 EMA? we look for long setups.
- To open a long position, the 15 EMA must be above the 50 EMA, when price touches or near the 50 EMA we look to go long.
- We place our stop loss a couple of pips below the 200 EMA.
NB, if the 15 ema crosses back below the 50 ema but prices remain below the 200 EMA, we stay out.
When EMA's are flat, or 15 EMA chopping around alot below and above 50 EMA stay out.
Because this is an Intra Day strategy, will look to lock in some profits and begin trailing as soon as price moves in the direction of our trade.
4&1 All Time Profit:
$37,496
