Interesting new site here where I can have my observations on crude in an orderly manner. Lets get down to business and start Crude
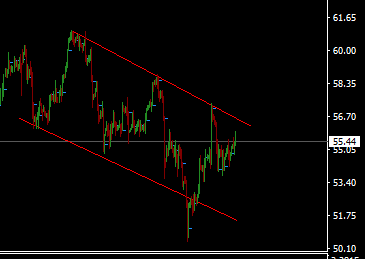
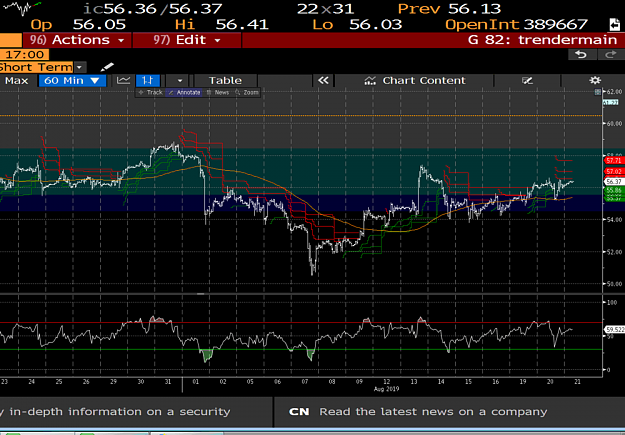
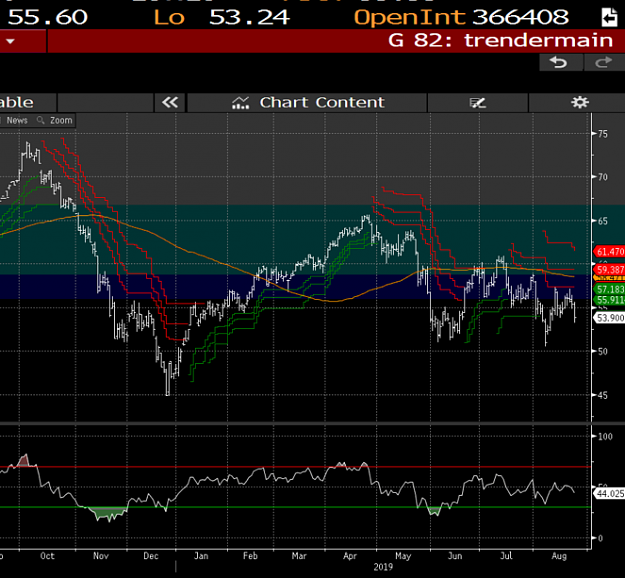
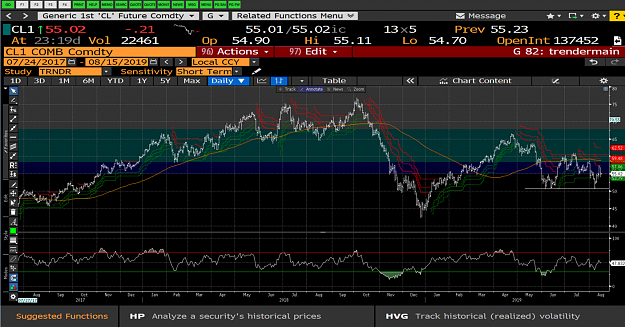
As the daily chart below shows, WTI currently locked in a sideways range with roughly $60 on the upside and $50 on the downside.
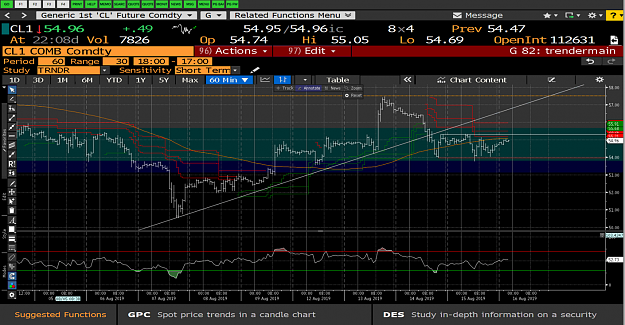
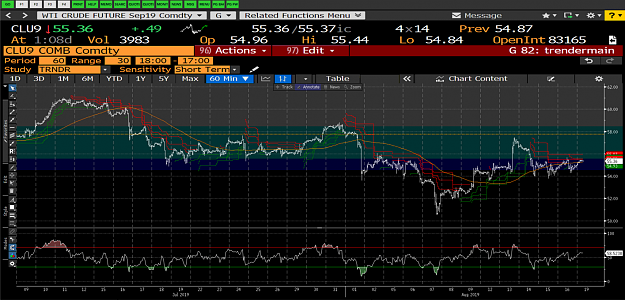
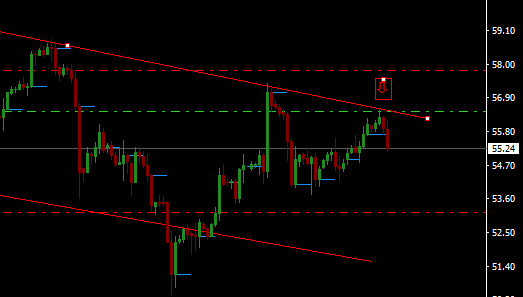
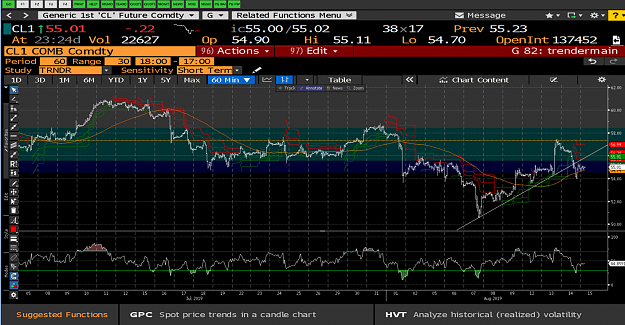
Here is where it gets interesting. Looking at the 60M chart, WTI has broken below its rising trendline which had been in place for nearly 7 days and is now facing resistance at $57 and appears to be headed to the lower end of the range.
As the daily chart below shows, WTI currently locked in a sideways range with roughly $60 on the upside and $50 on the downside.
Attached Image (click to enlarge)
Here is where it gets interesting. Looking at the 60M chart, WTI has broken below its rising trendline which had been in place for nearly 7 days and is now facing resistance at $57 and appears to be headed to the lower end of the range.
Attached Image (click to enlarge)