UPDATE 27 NOV 16
In the short time that this thread has been active there has been a lot of ideas for improvement and subsequent changes to the template. I will not completely re-write this post as the information contained below stiill forms the foundation of what the system was built on. The rules and templates that were posted on day 1 are still viable for profitable trading. Page 12 is the point that the new template started to take shape but to fully understand what is going on here anyone new to the thread must read everything that has been posted to date. I do not want to have to waste time by explaining again what can easily be answered by reading the first few pages.
Here is the new template as I have it. I have included RSI candles (period 8) but whether you use them or not is personal preference - I don't use them. If you do use them then you can drop the RSI Custom Indicator if you want.
V1 = 3 RSI and RSI custom in seperate windows.
V2 = 3 RSI overlaying RSI custom. These are in the zip folder. There is one for each TF.
TF Templates = Templates with correct indicatorsetting forvarious Time Frames.
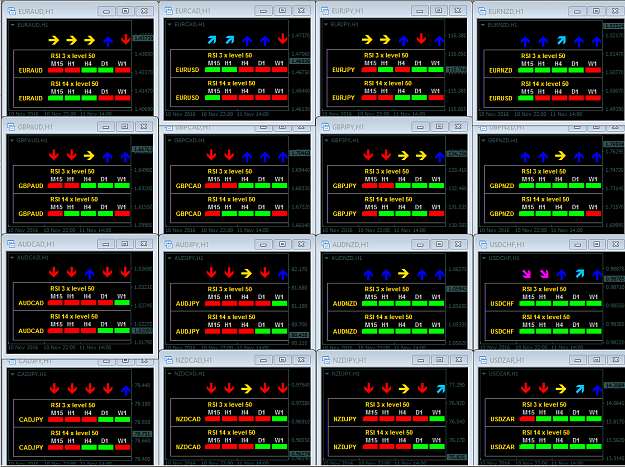
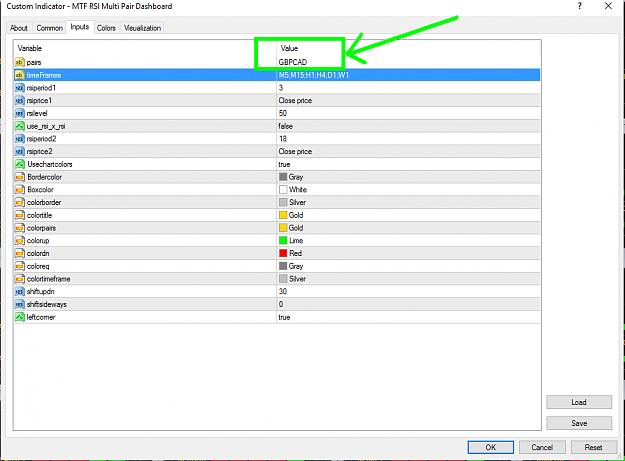
Note: MA and RSI Dashboard Indicators do not change to match the chart they are attached to automatically. They need to adjusted manually in the settings.
_________________________________________________________________________________________________________________
Thread rules and some general thoughts are below so please read and respect.
1. No Trolls - I don't know how to ban anyone but if I need to and I can, I will.
2. I am not an expert, but I have learned a thing or two. Give the thread a chance and if it is not for you please move on.
3. I believe that even the most experienced can still learn (even from those less exerienced).
4. My goal here is to develop this trading method for my own use and also to help some struggling traders if I can.
5.This thread is not intended to teach brand new traders the basics of trading so do your homework first.
6. I do not stick to traditionally accepted rules of money management and I will not discuss this aspect of trading. We are all responsible for our own profits and losses. I will however discuss ideas about SL and TP placement.
7. I will add to, delete or amend these points as required.
TEMPLATE (If other timeframes are used then the MAs below will need to be adjusted).
M5 Chart
10 EMA (blue solid)
10EMA applied to previous 10EMA (Pink solid)
120 EMA (Green Dotted) -this shows you the 10 EMA on H1
120 EMA applied to previous 120EMA (Orange Dotted) - this shows 10 EMA applied to previous 10 EMA on H1
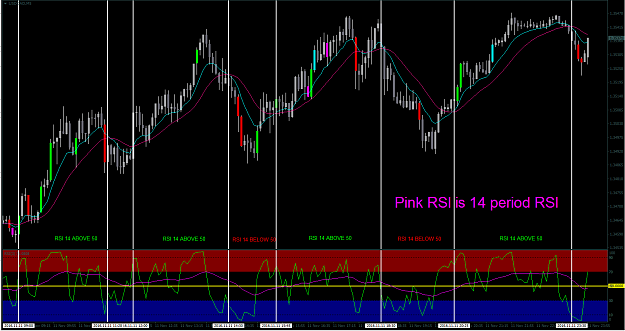
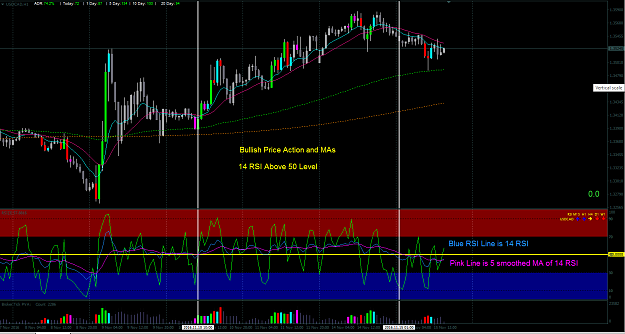
3 Period RSI - Levels 10-30-50-70-90. Below 30 = Oversold. Below 10= Very Oversold. Above 70 = Overbought. Above 90 = Very Overbought. Above 50= Bullish. Below 50 =Bearish.
H1 Chart
10 EMA (blue solid)
10 EMA applied to previous 10 EMA (Pink solid)
40 EMA (Green Dotted) - this shows you the 10 EMA on H4
40 EMA applied to previous 40 EMA (Orange Dotted) - this shows 10 EMA applied to previous 10 EMA on H4
RSI as above
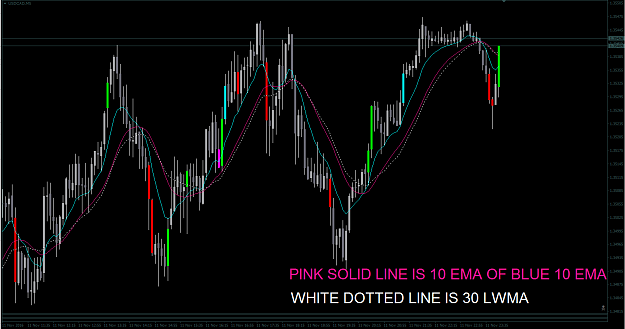
Here is the basic M5 template. If you want to use Volume Candles then you need to get them from the relevant threads as mentioned above.
Here is the M5 template with the RSI Dash added tothe bottom left corner. Just remember to adjust the RSI Dash settings to much the chart you apply it to.
Edited M5 and H1 Template - not using 30 lwma. using my preferred 10ema applied to previous 10 ema instead.
CONDITIONS FOR SHORT ENTRIES
The HTF 10EMA (Green dotted) should be below the HTF 10 of 10 EMA (orange dotted) line.
The 10 EMA (blue solid) should be below the 10 of 10EMA (pink solid) (M5 TF).
Let 3 RSI cross above 50 line and enter short when it crosses back below 50.
CONDITIONS FOR LONG ENTRIES
The HTF 10EMA (Green dotted) should be above the HTF 10 of 10 EMA (orange dotted) line.
The 10 EMA (blue solid) should be above the 10 of 10 EMA (pink solid) (M5 TF)
Let 3 RSI cross below 50 line and enter long when it crosses back above 50.
SHORT TRADE OPPORTUNITIES - EXAMPLE
The chart below shows you AUDUSD M5 for today and yesterday.
From the time when the H1 10EMA first crossed below the 30LWMA at the yellow square you will see that to this date it has not yet crossed above. THIS MEANS DO NOT BUY - WE WANT TO BE SELLERS.
Here is GBPJPY M5 - these are buying conditions - HTF 10 EMA is above HTF 30 LWMA. These conditions mean we want to be buyers.
STOP LOSS AND TAKE PROFIT
Where to put your SL and TP is a decision for yourself based on your risk appetite and how much drawdown you are willing to accept in order to end up with a profitable trade. I went through a period of unwillingness to accept a loss and of course that resulted in losing in the end. All this achieved was to induce undue stress and loss of money. Now I always use a SL. If I am scalping the M5 TF I place my SL below the 30 LWMA and move it up or down accordingly as price moves in the right direction. I don't care too much if I take a loss because there will be plenty winners.
I don't normally use a TP.
INDICATORS
1. Moving Averages - freely available to all in MT4 or other platform.
2. RSI - Again freely available. All I have done is add a couple of coloured boxes to highlight the OS and OB levels.
3. Volume Candles. Taken from PVSRA thread. To understand volume, which I recommend, please go to one of those threads. You can find a pdf called "PVSRA". I highly recommend it.
4. I use a MA cross indicator to alert me of possible opportunities when I am out and about and working. I DONT TRADE THE CROSS. I TRADE THE PULLBACK.
In the short time that this thread has been active there has been a lot of ideas for improvement and subsequent changes to the template. I will not completely re-write this post as the information contained below stiill forms the foundation of what the system was built on. The rules and templates that were posted on day 1 are still viable for profitable trading. Page 12 is the point that the new template started to take shape but to fully understand what is going on here anyone new to the thread must read everything that has been posted to date. I do not want to have to waste time by explaining again what can easily be answered by reading the first few pages.
Here is the new template as I have it. I have included RSI candles (period 8) but whether you use them or not is personal preference - I don't use them. If you do use them then you can drop the RSI Custom Indicator if you want.
V1 = 3 RSI and RSI custom in seperate windows.
V2 = 3 RSI overlaying RSI custom. These are in the zip folder. There is one for each TF.
TF Templates = Templates with correct indicatorsetting forvarious Time Frames.
Attached File(s)
Attached File(s)
Attached File(s)
Note: MA and RSI Dashboard Indicators do not change to match the chart they are attached to automatically. They need to adjusted manually in the settings.
_________________________________________________________________________________________________________________
Thread rules and some general thoughts are below so please read and respect.
1. No Trolls - I don't know how to ban anyone but if I need to and I can, I will.
2. I am not an expert, but I have learned a thing or two. Give the thread a chance and if it is not for you please move on.
3. I believe that even the most experienced can still learn (even from those less exerienced).
4. My goal here is to develop this trading method for my own use and also to help some struggling traders if I can.
5.This thread is not intended to teach brand new traders the basics of trading so do your homework first.
6. I do not stick to traditionally accepted rules of money management and I will not discuss this aspect of trading. We are all responsible for our own profits and losses. I will however discuss ideas about SL and TP placement.
7. I will add to, delete or amend these points as required.
TEMPLATE (If other timeframes are used then the MAs below will need to be adjusted).
M5 Chart
10 EMA (blue solid)
10EMA applied to previous 10EMA (Pink solid)
120 EMA (Green Dotted) -this shows you the 10 EMA on H1
120 EMA applied to previous 120EMA (Orange Dotted) - this shows 10 EMA applied to previous 10 EMA on H1
3 Period RSI - Levels 10-30-50-70-90. Below 30 = Oversold. Below 10= Very Oversold. Above 70 = Overbought. Above 90 = Very Overbought. Above 50= Bullish. Below 50 =Bearish.
H1 Chart
10 EMA (blue solid)
10 EMA applied to previous 10 EMA (Pink solid)
40 EMA (Green Dotted) - this shows you the 10 EMA on H4
40 EMA applied to previous 40 EMA (Orange Dotted) - this shows 10 EMA applied to previous 10 EMA on H4
RSI as above
Here is the basic M5 template. If you want to use Volume Candles then you need to get them from the relevant threads as mentioned above.
Attached File(s)
Here is the M5 template with the RSI Dash added tothe bottom left corner. Just remember to adjust the RSI Dash settings to much the chart you apply it to.
Attached File(s)
Edited M5 and H1 Template - not using 30 lwma. using my preferred 10ema applied to previous 10 ema instead.
Attached File(s)
Attached File(s)
CONDITIONS FOR SHORT ENTRIES
The HTF 10EMA (Green dotted) should be below the HTF 10 of 10 EMA (orange dotted) line.
The 10 EMA (blue solid) should be below the 10 of 10EMA (pink solid) (M5 TF).
Let 3 RSI cross above 50 line and enter short when it crosses back below 50.
CONDITIONS FOR LONG ENTRIES
The HTF 10EMA (Green dotted) should be above the HTF 10 of 10 EMA (orange dotted) line.
The 10 EMA (blue solid) should be above the 10 of 10 EMA (pink solid) (M5 TF)
Let 3 RSI cross below 50 line and enter long when it crosses back above 50.
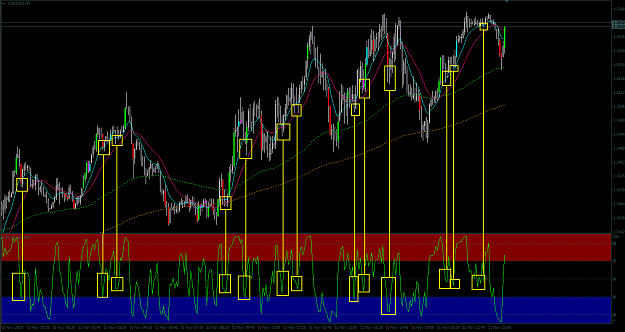
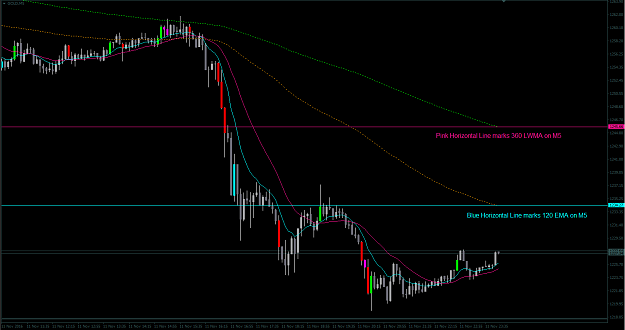
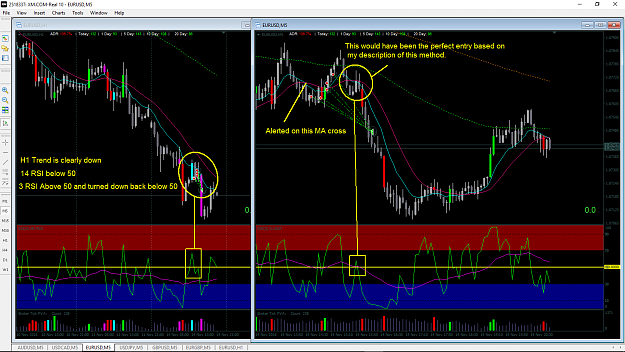
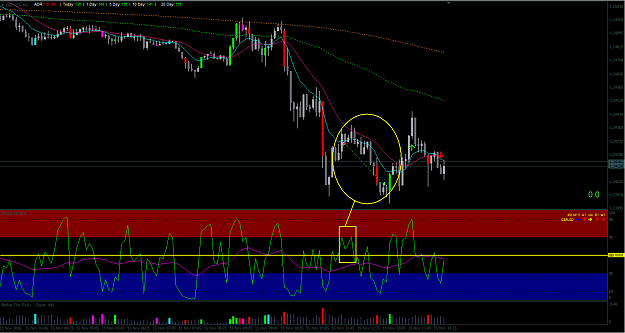
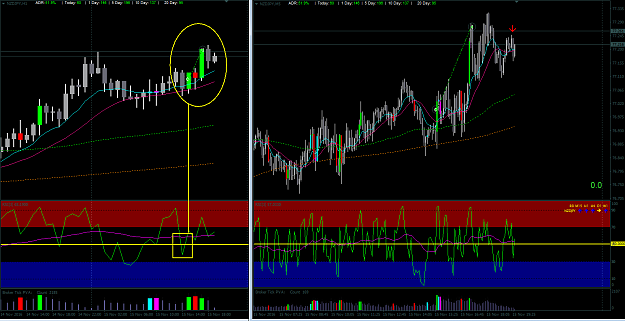
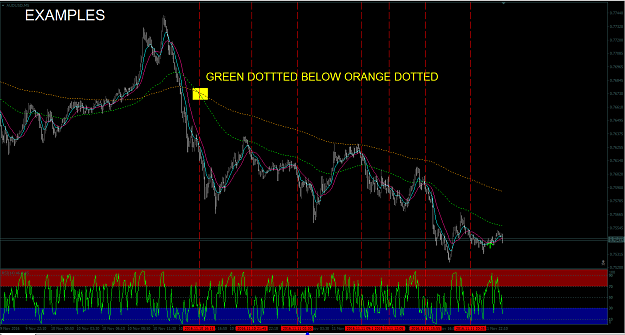
SHORT TRADE OPPORTUNITIES - EXAMPLE
The chart below shows you AUDUSD M5 for today and yesterday.
From the time when the H1 10EMA first crossed below the 30LWMA at the yellow square you will see that to this date it has not yet crossed above. THIS MEANS DO NOT BUY - WE WANT TO BE SELLERS.
Attached Image (click to enlarge)
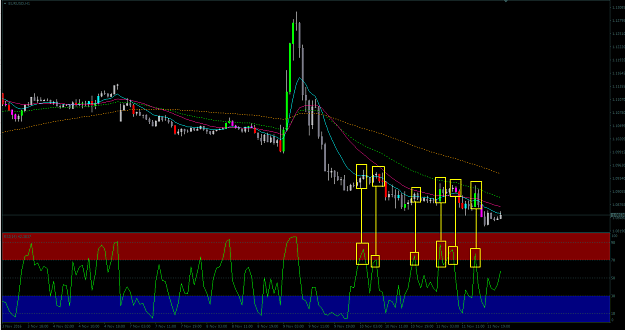
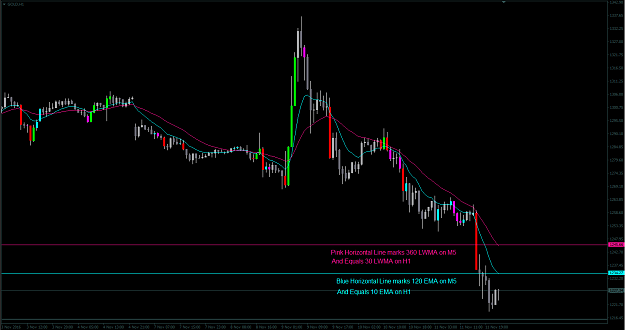
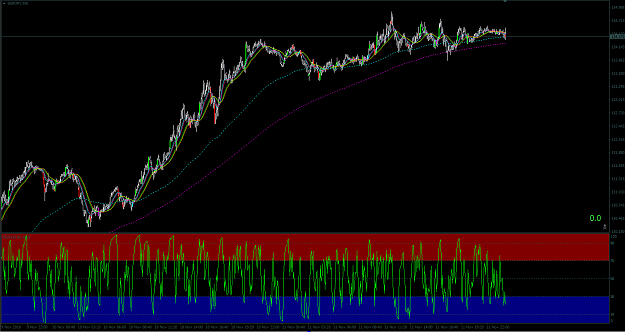
Here is GBPJPY M5 - these are buying conditions - HTF 10 EMA is above HTF 30 LWMA. These conditions mean we want to be buyers.
Attached Image (click to enlarge)
STOP LOSS AND TAKE PROFIT
Where to put your SL and TP is a decision for yourself based on your risk appetite and how much drawdown you are willing to accept in order to end up with a profitable trade. I went through a period of unwillingness to accept a loss and of course that resulted in losing in the end. All this achieved was to induce undue stress and loss of money. Now I always use a SL. If I am scalping the M5 TF I place my SL below the 30 LWMA and move it up or down accordingly as price moves in the right direction. I don't care too much if I take a loss because there will be plenty winners.
I don't normally use a TP.
INDICATORS
1. Moving Averages - freely available to all in MT4 or other platform.
2. RSI - Again freely available. All I have done is add a couple of coloured boxes to highlight the OS and OB levels.
3. Volume Candles. Taken from PVSRA thread. To understand volume, which I recommend, please go to one of those threads. You can find a pdf called "PVSRA". I highly recommend it.
4. I use a MA cross indicator to alert me of possible opportunities when I am out and about and working. I DONT TRADE THE CROSS. I TRADE THE PULLBACK.
Attached File(s)
Indentify > Plan > Accept > Execute