Hi All
This is my personal Testing /Skill Sharpening of Daily Road Map Strategy according to what i see in the market for opportunity.
Will Be Trading Any Opportunities coming thru the flow GOLD- FX- STOCKs - E-mini's Etc.... whenever my numbers fit I trade it
Note: NO INDICATORS MADE OR CREATED BY ME, I have traded the markets for many years. Mainly STOCKS and INDICES. with TDAmeritrade- Interactive Brokers and now I can try with forex .....maybe.
I stopped trading for awhile and i joined the car business ( good money trading cars. LOL ).
almost done there
My goal to get back into trading
So here I am here sharpening my skills learning from alot of you and hopefully you will learn something from me as well.
I will try to explain things, although im not a good teacher. however its simple fibo and range size. nothing to it.
I look at Volume Spread and SMA to confirm trend and break outs. and possible end of moves.
I also look at open gaps and 1st hour trading breakouts ( stocks only)
you can use any charting system. all you need is fibo volume pivot weekly or monthly range weekly or monthly and curve fitted few ticks to create a tradable picture possibility
Rules:
Respect respect respect
Im here to have fun. if this thread can help you in your trading, use it,
if not, move to next thread. You all are welcome to input and help improve my trading and yours
How i do the fibo. you can create it your self.
50% of weekly or monthly or pivot
Hi-Lo added on FIBO 50% or 100%Fibo ( Depending on where current price is. I guess)
And Curve Fitted.. SEEMS to DO Well for me.
I will Post as many opportunity as i can see. USE AT YOUR OWN RISK. No Advice or Recommendation made by me to anyone except commenting on my own posts.
Time Frame 30MIN
My analysis is simple of HLC (pivot) and FIBO
Indicators used : SMA 20 on 30min chart optional
Volume Indicator (for VSA) Optional
FIBO ( Range and duplicate phases)
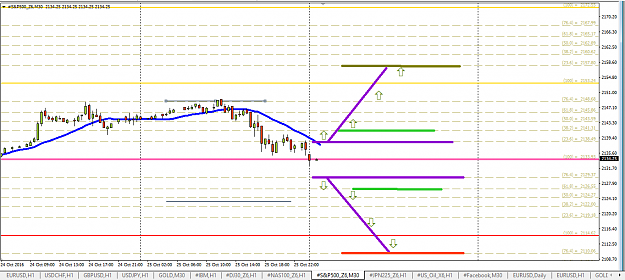
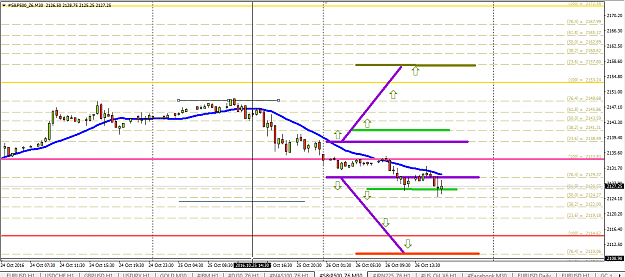
Strategy: Buy Above or Sell Below 23.6 fibo
Buy Above or Sell Below 76.3 fibo
I will Post as many opportunity as i can see. USE AT YOUR OWN RISK. No Advice or Recommendation made by me to anyone except commenting on my own posts.
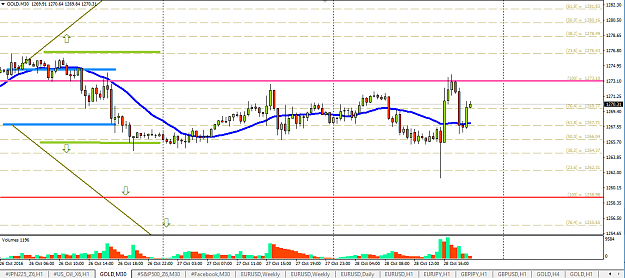
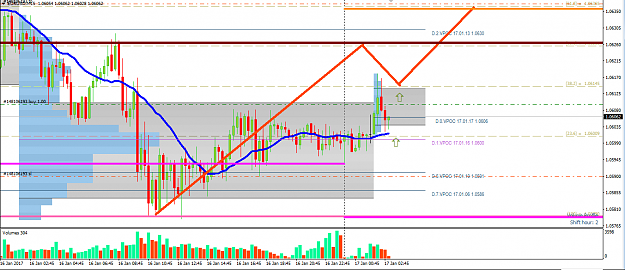
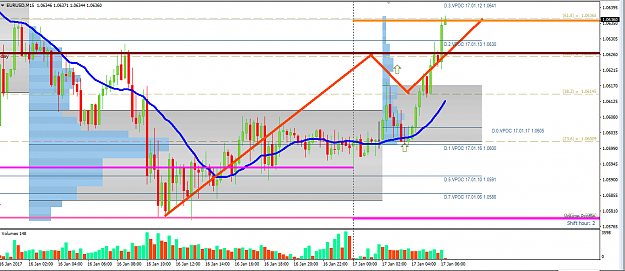
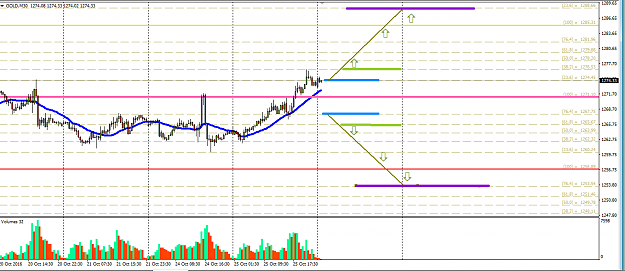
THIS CHART EXPLAINS
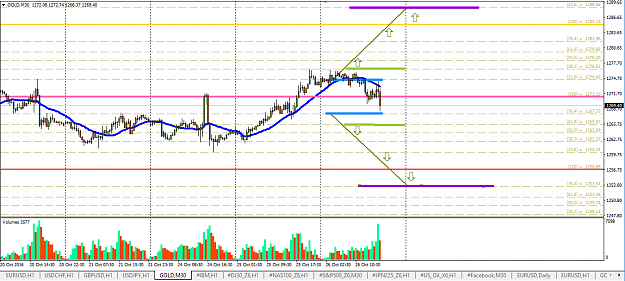
GOLD : Currently trading at 1274.20 which is 23.6% level , any break above this level indicates price will move another range phase up. which could mean 14pts
this move could come in within next few days.
before this happens. the market will first try to buy the lows. or buy a level below ( loading the guns) somewhere around 1271.00 100% level before we could see highs
How to trade this scenario : I would wait and see if price goes below 23.6% level first, then wait on 1271 or 100% level to buy. if price opens above 23.6 level I would wait for a pull back or close to pull back as possible toward 23.6% level and execute buy order.
Targets: Are the next 76.4% level 1281.00 then onto 23.6% 1288.00
Good Luck.
This is my personal Testing /Skill Sharpening of Daily Road Map Strategy according to what i see in the market for opportunity.
Will Be Trading Any Opportunities coming thru the flow GOLD- FX- STOCKs - E-mini's Etc.... whenever my numbers fit I trade it
Note: NO INDICATORS MADE OR CREATED BY ME, I have traded the markets for many years. Mainly STOCKS and INDICES. with TDAmeritrade- Interactive Brokers and now I can try with forex .....maybe.
I stopped trading for awhile and i joined the car business ( good money trading cars. LOL ).
almost done there
My goal to get back into trading
So here I am here sharpening my skills learning from alot of you and hopefully you will learn something from me as well.
I will try to explain things, although im not a good teacher. however its simple fibo and range size. nothing to it.
I look at Volume Spread and SMA to confirm trend and break outs. and possible end of moves.
I also look at open gaps and 1st hour trading breakouts ( stocks only)
you can use any charting system. all you need is fibo volume pivot weekly or monthly range weekly or monthly and curve fitted few ticks to create a tradable picture possibility
Rules:
Respect respect respect
Im here to have fun. if this thread can help you in your trading, use it,
if not, move to next thread. You all are welcome to input and help improve my trading and yours
How i do the fibo. you can create it your self.
50% of weekly or monthly or pivot
Hi-Lo added on FIBO 50% or 100%Fibo ( Depending on where current price is. I guess)
And Curve Fitted.. SEEMS to DO Well for me.
I will Post as many opportunity as i can see. USE AT YOUR OWN RISK. No Advice or Recommendation made by me to anyone except commenting on my own posts.
Time Frame 30MIN
My analysis is simple of HLC (pivot) and FIBO
Indicators used : SMA 20 on 30min chart optional
Volume Indicator (for VSA) Optional
FIBO ( Range and duplicate phases)
Strategy: Buy Above or Sell Below 23.6 fibo
Buy Above or Sell Below 76.3 fibo
I will Post as many opportunity as i can see. USE AT YOUR OWN RISK. No Advice or Recommendation made by me to anyone except commenting on my own posts.
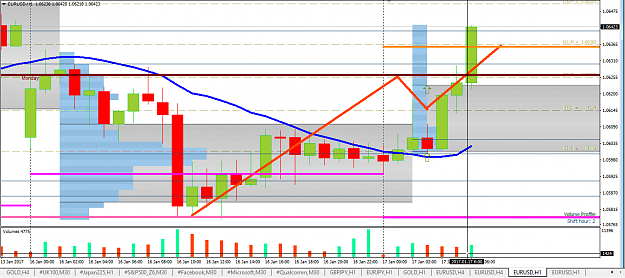
THIS CHART EXPLAINS
GOLD : Currently trading at 1274.20 which is 23.6% level , any break above this level indicates price will move another range phase up. which could mean 14pts
this move could come in within next few days.
before this happens. the market will first try to buy the lows. or buy a level below ( loading the guns) somewhere around 1271.00 100% level before we could see highs
How to trade this scenario : I would wait and see if price goes below 23.6% level first, then wait on 1271 or 100% level to buy. if price opens above 23.6 level I would wait for a pull back or close to pull back as possible toward 23.6% level and execute buy order.
Targets: Are the next 76.4% level 1281.00 then onto 23.6% 1288.00
Good Luck.
Attached Image (click to enlarge)
Frank Fadi