why this level and text merging i dont know... if it come like next pic it is good.. will any one please .... small small helps i seeking here with out knowledge of coding
{quote} To me it is all a bit confusing as you talk about EMA/SMA band. Which one is it EMA or SMA? Also, you mention a band 34/55/89. Are they bands or are they MAs? I don't see anything on your chart for this unless it is the yellow and orange indicator(s) on your chart? What are those lines. Are there any indicators that you are using that are not standard to MT4? If so, I need the mq4 file. I know most of this is standard stuff. I am getting what you mean for dev1 and dev2. I am not getting what you mean by EMA/SMA bands 34/55/89. Initially...
Ignored
yea some time simple things seems so comlicated ..it is based on all default mt4 indicator (this the beauty of this system) ema /sma mean EA should have option to choose ema or sma and EA will open based on one band like 34/55/89 (period options/ changeable) ema high and low if i chose ema than 34sma hi and low or you just create for only ema no problem .i hope now it is clear ..see it as simple and if you tase it than you will see the charm.i a ttached temp .any questions please ask me.thanks.even gold ..i can show you 100/1000 .you just back test .you will be amazed.
I have posted one indicator in the past asking someone to modify it but no one helped.. wish now i will be lucky and you or others can help me to make this indicator which i blv it will be unique indicator.
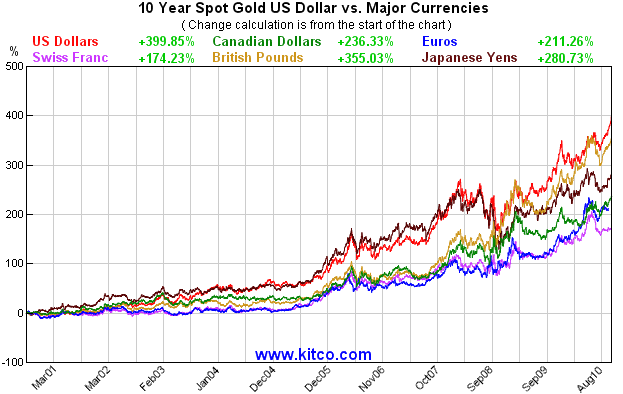
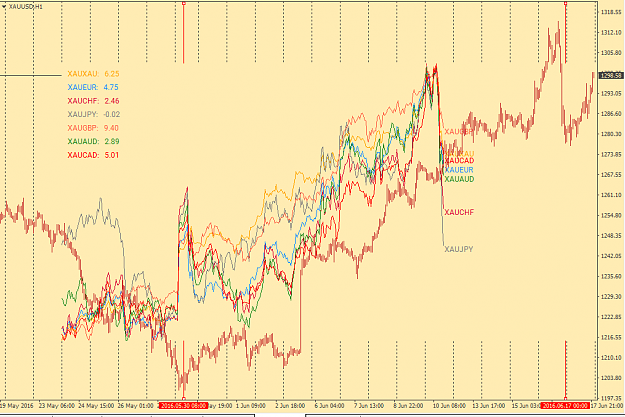
To go strict to the point, Measuring strength of currencies but not relative to each others, i want to measure the gold performance vs each currency individually. i have exported the data from each pair of the following: XAUUSD, USDCAD, USDJPY, USDCHF, EURUSD, GBPUSD, NZDUSD and AUDUSD to excel, i got then the value for XAUEUR, XAUBGP, XAUNZD, XAUAUD, XAUCAD, XAUJPY and XAUCHF.. I have a very nice profitable trading strategy using these data but the problem is it is difficult to analyze and visualize these data in excel as i have only numbers, what i am looking for is a simple indicator which shows the value daily % change (preferably to have an option to choose the interval of calculation like hourly, 4H, etc.) of each of the following pairs XAUUSD, XAUEUR, XAUBGP, XAUNZD, XAUAUD, XAUCAD, XAUJPY and XAUCHF. The indicator should look something like the picture that i have posted down. I am opened to share my strategy which requires additional indicators.
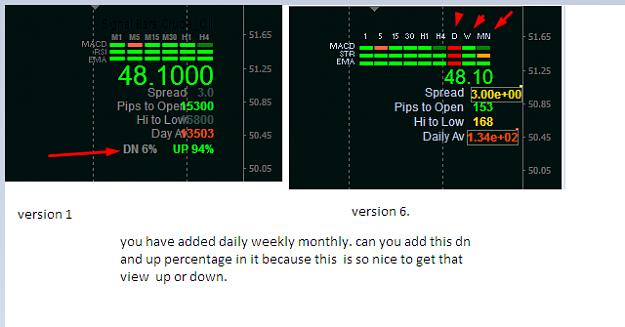
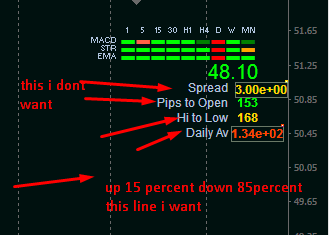
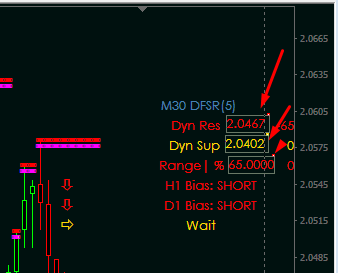
hi cja i found one of your great indicator signal bars v1.in my collections... but when i seen v6 it is amazing with added time frames... for d,w,m.... wow... i want only one that i mention in pic
Attached Image (click to enlarge)
Attached Images
Success is a Journey Not a Destination....... kind regards ramzam
{quote} yea some time simple things seems so comlicated ..it is based on all default mt4 indicator (this the beauty of this system) ema /sma mean EA should have option to choose ema or sma and EA will open based on one band like 34/55/89 (period options/ changeable) ema high and low if i chose ema than 34sma hi and low or you just create for only ema no problem .i hope now it is clear ..see it as simple and if you tase it than you will see the charm.i a ttached temp .any questions please ask me.thanks.even gold ..i can show you 100/1000 .you just...
Ignored
You cannot create one band out of 3 different periods, 34/55/89. You can either use 3 MAs at those periods or use 1 or 3 bands at those periods.
"if i chose ema than 34sma hi and low" - This sentence makes no sense.
I am getting most of what you are saying, I am sorry there seems to be a bit of a language barrier in between.
hi cja i found one of your great indicator signal bars v1.in my collections... but when i seen v6 it is amazing with added time frames... for d,w,m.... wow... i want only one that i mention in pic {image} {image} {image}
Ignored
Signal Bars indicators are only designed to work on Forex currency pairs not Oil / Gold / Silver / Dow etc etc
NOTE : The percentage UP/DOWN is not available with any of the Signal Bar versions posted on any Forum, if you have a Signal Bars with that function it must be a decompiled version which I definitely will not work on.
{quote} You cannot create one band out of 3 different periods, 34/55/89. You can either use 3 MAs at those periods or use 1 or 3 bands at those periods. "if i chose ema than 34sma hi and low" - This sentence makes no sense. I am getting most of what you are saying, I am sorry there seems to be a bit of a language barrier in between. Daniel
Ignored
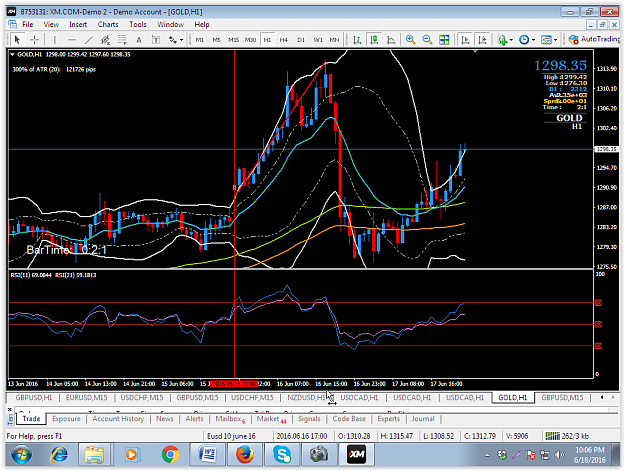
sir,i already told you just one band like 100 ema (period change options include) high and low used and also i gave you template i don't know why you cant understand .please check template and input.better first you create indicator then go for EA ..
one more time if price go below /above.....then short/long say red/green arrow show /signal alert
1.100 ema High and LOw for ema band to check trend
2.bollinger ban period 20 deviations 2 and another same period but deviations 1 and price go lower bb area short and upper go long
3.rsi period 9 and another 21 ...9 period cross from above and go below level 50 and 21 follow short and opposite long
Hello cja, and all others ... Measuring strength of currencies but not relative to each others, i want to measure the gold performance vs each currency individually. i have exported the data from each pair of the following: XAUUSD, USDCAD, USDJPY, USDCHF, EURUSD, GBPUSD, NZDUSD and AUDUSD to excel, i got then the value for XAUEUR, XAUBGP, XAUNZD, XAUAUD, XAUCAD, XAUJPY and XAUCHF.. The indicator should look something like the picture that i have posted down. I am opened to share my strategy which requires additional indicators. Thanx in advance...
Ignored
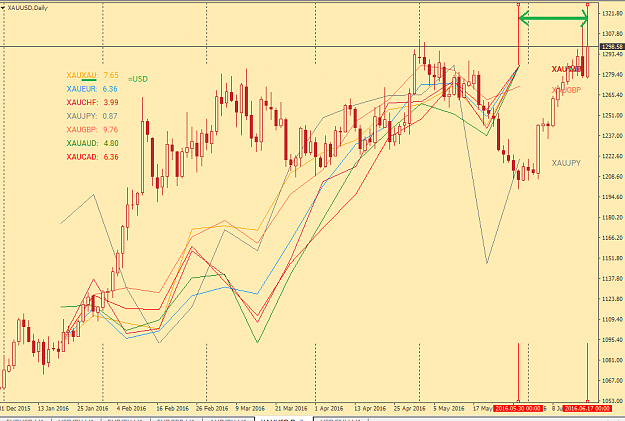
Is this something you are looking for?
Attached Image (click to enlarge)
Attached Image (click to enlarge)
Note: XAUXAU = XAUUSD (because of a loop in code)
It works like this:
1. Choose a range by using 2 red vertical lines
2. Run a script on H1 or D1 timeframe. (H4 have missing bars, USDCNH have missing bars too)
{quote} Is this something you are looking for? {image} {image} Note: XAUXAU = XAUUSD (because of a loop in code) It works like this: 1. Choose a range by using 2 red vertical lines 2. Run a script on H1 or D1 timeframe. (H4 have missing bars, USDCNH have missing bars too) Anyway, thanks for the idea, i figure out too. http://www.statista.com/statistics/2...gold-reserves/https://en.wikipedia.org/wiki/Gold_reserve
Ignored
Hello Zelo, thank you for your response... yes i am looking for something like what you showed in the image but was better to be a regular indicator which you can attach to the chart .. but this one is ok as well thank you so much. where can i find that script? and looking at the chart you have posted i can see the indicator was drawing data from chosen intervals, is there any way to make it run on real time data?
{quote} ... better to be a regular indicator which you can attach to the chart .. i can see the indicator was drawing data from chosen intervals, is there any way to make it run on real time data? Best regards
Ignored
It is simple, just remove the right vertical line, only use left side as the reference point, transform the script to an indicator or EA to use tick data. Bonus: Add some button to show/hide some pairs to see chart clearer.
But i am lazy right now . I will do another time.
When you lose, I'm the loudest who laugh at your face )
{quote} Signal Bars indicators are only designed to work on Forex currency pairs not Oil / Gold / Silver / Dow etc etc NOTE : The percentage UP/DOWN is not available with any of the Signal Bar versions posted on any Forum, if you have a Signal Bars with that function it must be a decompiled version which I definitely will not work on.
Ignored
if it is work for currency pairs then it may work for Oil/Gold/ Silver/ Dow also.. but why it is not working.. THEN CAN YOU PLEASE ARRANGE IT FOR WORKING FOR IT PLEASE ... AS YOU KNOW HOW TO DO IT..
when i attach this indicator it deletes all other indicator lines and messages.. i don't know why... can any one possible to fix this please and one more i want in the line style.. instead of full page horizontal line need is short line.
{quote} It is simple, just remove the right vertical line, only use left side as the reference point, transform the script to an indicator or EA to use tick data. Bonus: Add some button to show/hide some pairs to see chart clearer. But i am lazy right now . I will do another time.
Ignored
OK thank you a lot, but i didnt know till now where can i get that script from... would appreciate if you can share it with me.
Parameter are in .txt file
I try it
But it is not working proper.
It is failed to return at its starting point ( at first trade ) when chart empty.
EA is attached
Regards
{quote} Hi CJA, Can you please modify this indicator to accommodate this suggestion which will help in drawing up a sort of trading target area? If the trading target area is similar to setting up manual grid? Manual grid is based on price. My idea is to extend manually drawn price grid to extend by a selected number of bars in future so that we can manually estimate/forecast mean reversion time in number of bars and in term of date+time and wait for it. Basically setting up an horizontal channel. {image}
Ignored
If you can kindly provide in the existing indicator a facility to paint future session in terms of number of bars as a rectangle, it will serve the purpose. By pushing bar shift button the future number of bars will be visible.
//i am using this indicator. i don't have mq4. when i detach the indicator after use it is not deleting lines and shades.. any one have this indicator mq4 means please help
Success is a Journey Not a Destination....... kind regards ramzam
I have got the required one. Now I want to show one more option that will show the market mode. I edited to add this option upon condition " When among largest 5 bars if no. of bullish bars is greater than bearish then Buy mode and vice-versa". But I am sad as my edited part does not work. Please go through the coding and help. cyber1 Sir {file} {image}
Ignored
bip-
Using a 'for loop' is simpler and more efficient than all the 'if statements'. Not sure it does what you want though.
sorry i found the source from this page ........http://www.forexfactory.com/showthread.php?t=72002 //i am using this indicator. i don't have mq4. when i detach the indicator after use it is not deleting lines and shades.. any one have this indicator mq4 means please help