Relative Strength Index RSI(14)
When RSI tags 70 or higher you have confirmed existence of uptrend (impulse wave(s)).
IF then RSI in correction holds above 40 and turns up, you have possible confirmation of the end of corrective wave(s) (ABC type of correction is my favorite but be careful, you could also have ABCD or only one corrective wave in strong trends).
When RSI tags 30 or lower you have confirmed existence of downtrend (impulse wave(s)).
IF then RSI in correction holds below 60 and turns down, you have possible confirmation of the end of corrective wave(s).
Also pay attention to divergences between PA and RSI when RSI is in oversold (30) or overbought (70) territory. You could be looking at meaningful correction or ever reversal of PA.
Fibonacci retracements and extensions
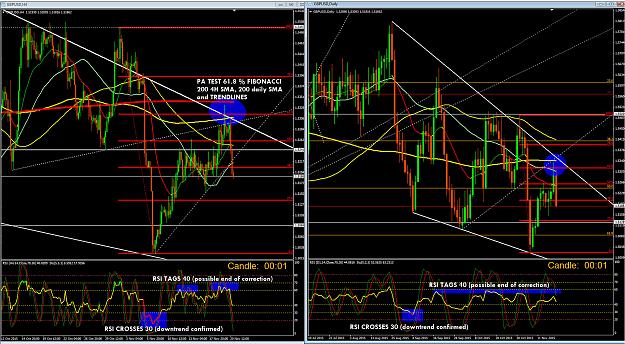
After you have confirmed trend (70 - uptrend, 30 - downtrend) and price action (PA) has established price bottom, you apply Fibonacci retracement levels. Then you wait for PA to retrace to 38.2 %, 50 %, 61.8 % or 78.6 % and enter a trade (50 and 61.8 % are my favorite levels of retracements. I only take a trade at 38.2 % retracement if trend is VERY strong). Set stop loss below 78.6 % or 100 % retracement level.
Identifying which retracement level if any will hold is the most tricky part of Fibonacci trading. When you see trend line, support/resistance, 50, 100 or 200 simple moving average in proximity of Fibonacci level, there is good chance that level will hold (I usually wait for short consolidation around Fibonacci level or some candlestick reversal pattern at Fibonacci level before I take a trade).
After establishing legit entry point you have to establish possible take profit point(s), here Fibonacci extensions come into play:
If PA reverses at 38.2 % retracement there is good chance price will reach 138.2 % extension.
If PA reverses at 50 % or 61.8 % retracement there is good chance price will reach 161.8 % extension.
If PA reverses at 78.6 % retracement there is good chance price will test price bottom again or reach 118.1 % extension.
Fibonacci extensions are only general guides where PA could consolidate or reverse. You have to pay attention to resistance/support levels, 50, 100, 200 simple moving averages and existing price patterns in the way.
Moving averages
Moving averages are very important trend verification indicators. They also tend to work as support/resistence, so we have to pay attention how PA behaves when it touches them (bouncing off or breaking through). I use 21 exponential moving average (EMA), 50, 100 and 200 simple moving averages (SMA).
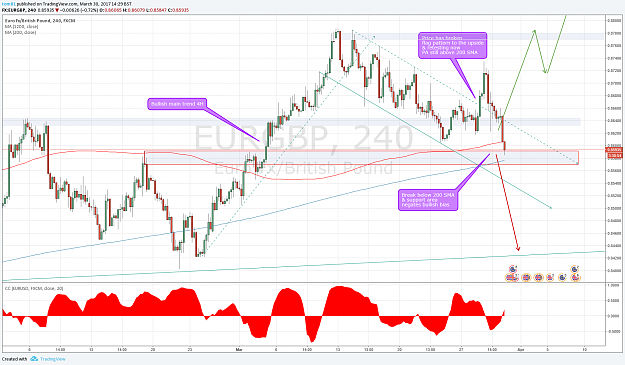
I usually take only short trades when price is under 200 SMA, and long trades when price is over 200 SMA. PA corrections tend to find resistence near 21 EMA and 50 SMA in strong trends. If 50 SMA is broken, you could be looking at more meaningful correction or even reversal if PA breaks above/under 200 SMA.
The best trading setups are usually when PA enters a trend then retraces 50 or 61.8 % percent and you have a cluster of 50, 100 and 200 SMA behind these Fibonacci retracements.
Multiple time frames
Fibonacci levels work better on higher time frames (less market noise, institutional traders use higher time frames). I use daily chart to define longer term trends/consolidation ranges and take trades on 4-hour chart (I also look 1-hour chart for fine tuning entry point) only in agreement with daily chart.
Speculative Sentiment Index (SSI)
In addition to Fibonacci and RSI you can use the long-short ratios graph to trade counter the crowds. Retail traders are usualy wrong and institutional traders are usualy right in the long run. So why not trade in the same direction as big boys do? You can find free SSI at Dailyfx, Dukascopy (SWFX Sentiment index) and Oanda (forex historical position ratios).
Risk/money management (MOST IMPORTANT PART IN TRADING)!
Take only trades with risk/reward ratio 1:2 or higher (I usually only take trades with 1:2.5 or higher).
Be prepared to be on the wrong side of the market more often than not, but as long as your win/loss ratio is higher than 33 % (risk/reward ratio 1:2) or 25 % (risk/reward ratio 1:3) you will be making money in the long run.
Make sure that 3 % is maximum capital exposure on anyone trade and 6 % maximum exposure on all open positions (I never risk more than 1 % per trade).
Please test it on demo account for at least six months and be at least breakeven if not profitable before going live (I was trading demo account and learning for years before going live).
When RSI tags 70 or higher you have confirmed existence of uptrend (impulse wave(s)).
IF then RSI in correction holds above 40 and turns up, you have possible confirmation of the end of corrective wave(s) (ABC type of correction is my favorite but be careful, you could also have ABCD or only one corrective wave in strong trends).
When RSI tags 30 or lower you have confirmed existence of downtrend (impulse wave(s)).
IF then RSI in correction holds below 60 and turns down, you have possible confirmation of the end of corrective wave(s).
Also pay attention to divergences between PA and RSI when RSI is in oversold (30) or overbought (70) territory. You could be looking at meaningful correction or ever reversal of PA.
Fibonacci retracements and extensions
After you have confirmed trend (70 - uptrend, 30 - downtrend) and price action (PA) has established price bottom, you apply Fibonacci retracement levels. Then you wait for PA to retrace to 38.2 %, 50 %, 61.8 % or 78.6 % and enter a trade (50 and 61.8 % are my favorite levels of retracements. I only take a trade at 38.2 % retracement if trend is VERY strong). Set stop loss below 78.6 % or 100 % retracement level.
Identifying which retracement level if any will hold is the most tricky part of Fibonacci trading. When you see trend line, support/resistance, 50, 100 or 200 simple moving average in proximity of Fibonacci level, there is good chance that level will hold (I usually wait for short consolidation around Fibonacci level or some candlestick reversal pattern at Fibonacci level before I take a trade).
After establishing legit entry point you have to establish possible take profit point(s), here Fibonacci extensions come into play:
If PA reverses at 38.2 % retracement there is good chance price will reach 138.2 % extension.
If PA reverses at 50 % or 61.8 % retracement there is good chance price will reach 161.8 % extension.
If PA reverses at 78.6 % retracement there is good chance price will test price bottom again or reach 118.1 % extension.
Fibonacci extensions are only general guides where PA could consolidate or reverse. You have to pay attention to resistance/support levels, 50, 100, 200 simple moving averages and existing price patterns in the way.
Moving averages
Moving averages are very important trend verification indicators. They also tend to work as support/resistence, so we have to pay attention how PA behaves when it touches them (bouncing off or breaking through). I use 21 exponential moving average (EMA), 50, 100 and 200 simple moving averages (SMA).
I usually take only short trades when price is under 200 SMA, and long trades when price is over 200 SMA. PA corrections tend to find resistence near 21 EMA and 50 SMA in strong trends. If 50 SMA is broken, you could be looking at more meaningful correction or even reversal if PA breaks above/under 200 SMA.
The best trading setups are usually when PA enters a trend then retraces 50 or 61.8 % percent and you have a cluster of 50, 100 and 200 SMA behind these Fibonacci retracements.
Multiple time frames
Fibonacci levels work better on higher time frames (less market noise, institutional traders use higher time frames). I use daily chart to define longer term trends/consolidation ranges and take trades on 4-hour chart (I also look 1-hour chart for fine tuning entry point) only in agreement with daily chart.
Speculative Sentiment Index (SSI)
In addition to Fibonacci and RSI you can use the long-short ratios graph to trade counter the crowds. Retail traders are usualy wrong and institutional traders are usualy right in the long run. So why not trade in the same direction as big boys do? You can find free SSI at Dailyfx, Dukascopy (SWFX Sentiment index) and Oanda (forex historical position ratios).
Risk/money management (MOST IMPORTANT PART IN TRADING)!
Take only trades with risk/reward ratio 1:2 or higher (I usually only take trades with 1:2.5 or higher).
Be prepared to be on the wrong side of the market more often than not, but as long as your win/loss ratio is higher than 33 % (risk/reward ratio 1:2) or 25 % (risk/reward ratio 1:3) you will be making money in the long run.
Make sure that 3 % is maximum capital exposure on anyone trade and 6 % maximum exposure on all open positions (I never risk more than 1 % per trade).
Please test it on demo account for at least six months and be at least breakeven if not profitable before going live (I was trading demo account and learning for years before going live).
Attached Image (click to enlarge)