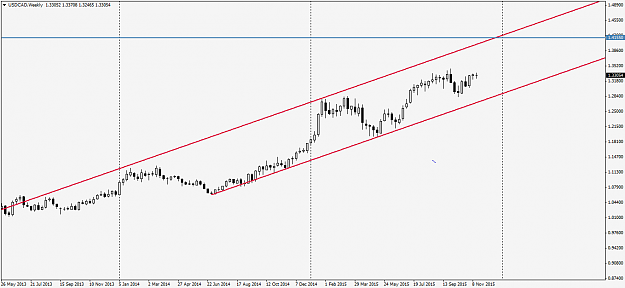
I am talking about pair the USDCAD which on the monthly started up so high in 2002 then slowly dropped down and then recently rose up to about 50% of how this pair started out in 2002.
It is reaching newer highs in recent month and the last high was in year 2009 which price has now overshot.
My question is were you to trade this pair do you look at the beginning of the chart from year 2002 and compare it to price right now in which case it wouldn't be considered a high since price is now rising up around 50% from year 2002 but were you to compare it to more recent times say around year 2009 which was a lower high compared to price today obviously price would be considered a high and in fact overbought.
So how do you judge if a pair is in a high or a low? Do you look right at the beginning or look at the most recent high/low?