I invented the following values just for the example. Imagine I have an strategy with this expected outcome:
Strategy 1x:
- Monthly gain: 4%
- Expected drawdown: 12%
My understanding is that if I copy-trade that strategy with a risk multiplier based on account equity of 4x, this will be the expected outcome:
Strategy 4x:
- Monthly gain: 16%
- Expected drawdown: 48%
Now suppose that at any given point both strategies have an equity of 10,000$. Then suddenly the max drawdown of both strategies is reached, so Strategy 1x reaches 8,800$ (12% drawdown) and Strategy 4x reaches 5,200$ (48% drawdown). After reaching this max drawdown, the strategies start performing well and reach their expected monthly gains exactly and consistently until they both reach 10,000$ again.
Based on the previous statements I would expect something like seen in equity graph A below, where the green line is Strategy 1x and the red line is Strategy 4x:
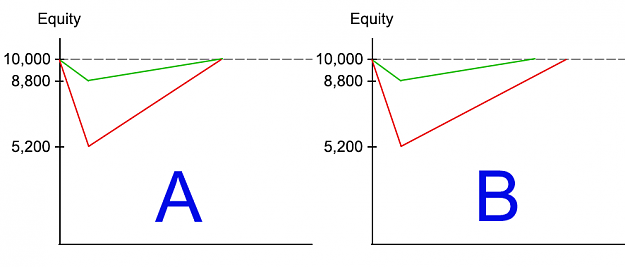
However, actual calculations tell me that's not gonna happen. Actual calculations tell me that it will take more time to reach 10,000$ again to the Strategy 4x, that is the red line in graph B above.
The way I calculated it is as follows:
Strategy 1x: 8800 * 1.04^x = 10000, where x is the months until reaching 10,000$ -> x = 3,26 months
Strategy 4x: 5200 * 1.16^x = 10000, where x is the months until reaching 10,000$ -> x = 4,41 months (more time!)
At this point I'm totally confused about what would really happen, A or B, and I hope someone can put some light on the matter.
Strategy 1x:
- Monthly gain: 4%
- Expected drawdown: 12%
My understanding is that if I copy-trade that strategy with a risk multiplier based on account equity of 4x, this will be the expected outcome:
Strategy 4x:
- Monthly gain: 16%
- Expected drawdown: 48%
Now suppose that at any given point both strategies have an equity of 10,000$. Then suddenly the max drawdown of both strategies is reached, so Strategy 1x reaches 8,800$ (12% drawdown) and Strategy 4x reaches 5,200$ (48% drawdown). After reaching this max drawdown, the strategies start performing well and reach their expected monthly gains exactly and consistently until they both reach 10,000$ again.
Based on the previous statements I would expect something like seen in equity graph A below, where the green line is Strategy 1x and the red line is Strategy 4x:
Attached Image (click to enlarge)
However, actual calculations tell me that's not gonna happen. Actual calculations tell me that it will take more time to reach 10,000$ again to the Strategy 4x, that is the red line in graph B above.
The way I calculated it is as follows:
Strategy 1x: 8800 * 1.04^x = 10000, where x is the months until reaching 10,000$ -> x = 3,26 months
Strategy 4x: 5200 * 1.16^x = 10000, where x is the months until reaching 10,000$ -> x = 4,41 months (more time!)
At this point I'm totally confused about what would really happen, A or B, and I hope someone can put some light on the matter.