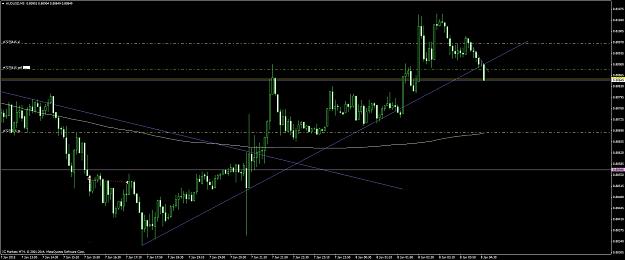
In this journal I hope to be able to record my trades when I can for the simple fact of being able review my history. I have called this "Trend lines and Analysis" because I mainly deal with TL BO's. I have a scope of trading systems however and wont limit myself to just one type of analysis.
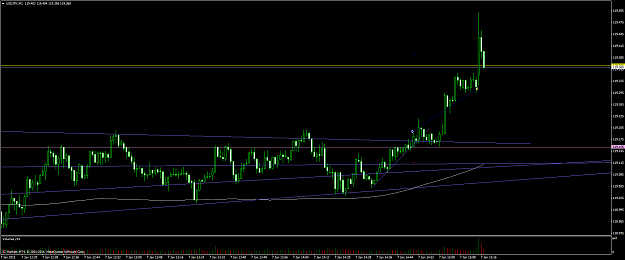
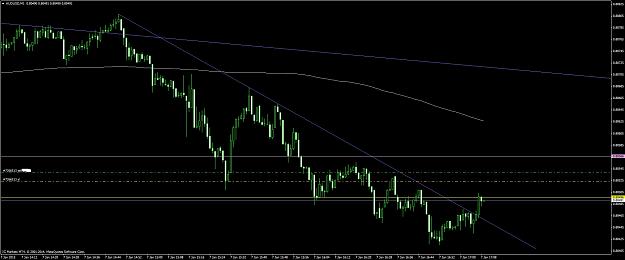
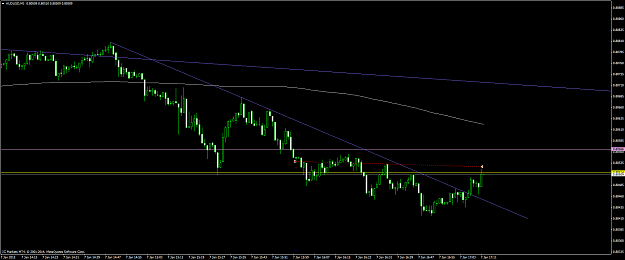
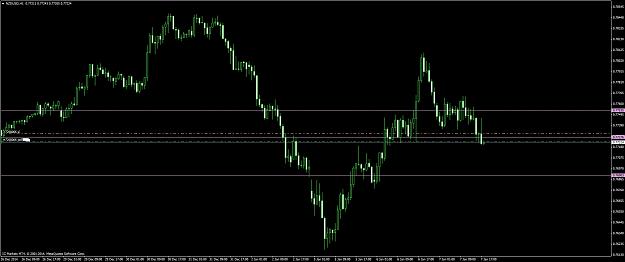
I trade mostly from the hourly charts but break it down to the 5m and even 1m when I spot a potential trade. I am looking for 20 pip BO's risking roughly 5-10 pips at a time. Depending on the BO I can increase my TP if I see potential further movement but this has also got me in trouble in the past and it is part of my strategy that I am looking to analyse here. I watch all majors and a few of the minors but importantly I try to stay away from highly volatile pairs eg GJ unless I can justify a low risk trade. I have found the best time to trade is the Asian session but often stare at the charts for many more hours.
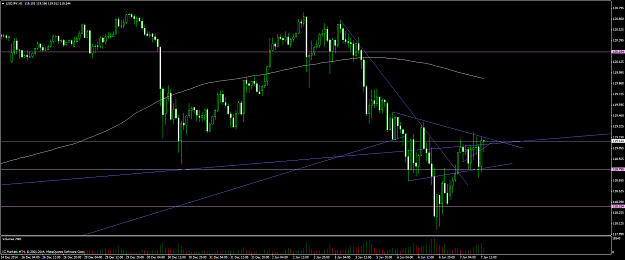
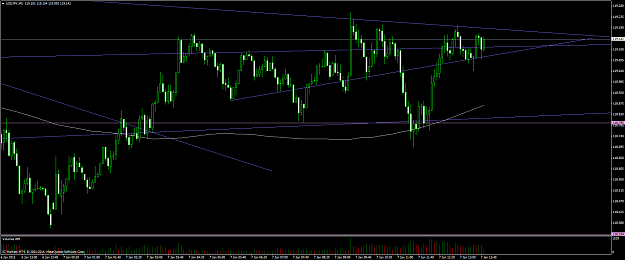
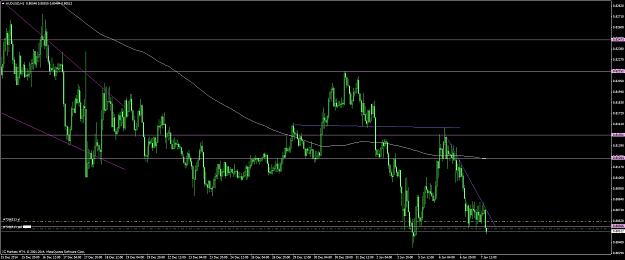
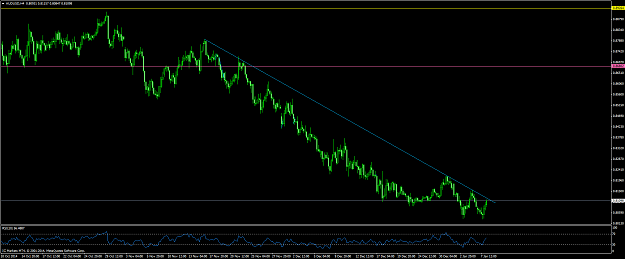
I have no specific rules about drawing my TL's except to say that I am looking for where the price action stops most commonly whether that be the wick or body of the candle. In drawing the TL's, often a pattern becomes apparent which is a big part of my strategy. Common patterns I use are the Wedge, Flag, Cup & Handle, Head & Shoulder, etc.
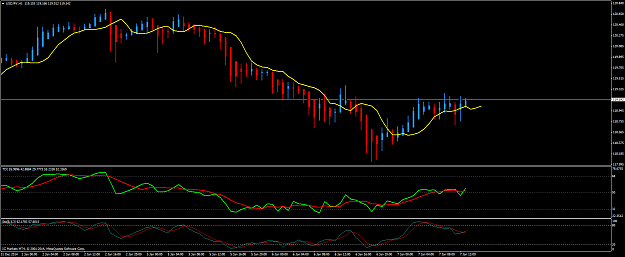
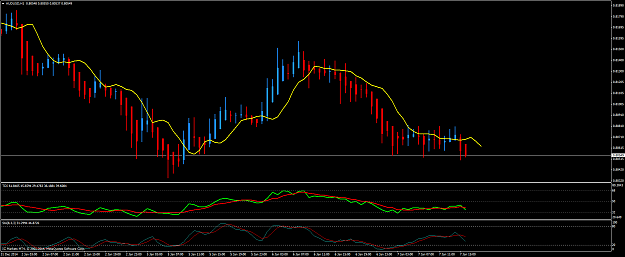
To identify trade set ups I also use the Trading Made Simple template ( http://www.forexfactory.com/showthread.php?t=291622 ) on hourly charts. I am looking for specific setups with the TDI cross over that's not over bought/sold in the direction to trade and also that isn't running into S/R zones. I will provide an example later. If I identify a TMS trade setup I will go to my normal charts and look for a possible low risk trade.
I am trying to find consistency in my method because I am trying for high risk (leveraged) gains. Each trade I am risking roughly 10% of the current balance. I traded consistently for around 10 weeks at the end of last year but the first 6 weeks I was gaining then losing. I finally figured that it was the highly volatile pairs that were getting me into trouble (GJ, Gold etc) and after I realised this my account grew 1400%. However leading up to the Christmas break I began taking losses so stopped trading believing it was "just the market". I have started trading again this week but am still dismally taking losses. I am beginning to think that a part of the strategy that I was employing during my success is being left out. Perhaps I was using more correlation or maybe I am trading the st charts too much atm or maybe it is just a difficult time to trade being the new year and the NFP week (I have always struggled on this week of the month).
Anyhows, I will be posting my charts when I can but probably wont give too much description in my posts due to time issues unless it is needed. They should be pretty self explanatory. If anyone happens across any of my posts please feel free to ask questions or comment. If people want to post their own TL's on any currency it is always welcome- I often have the same TL on two of the same charts but is a little different in comparison. All angles are good.
Edit (19.2.15): I have started using Harmonics and more awareness of Order Flow with my trading.
Edit (22/9/2015): I am using larger pip R:R, with 2:1 R:R for this strategy: http://www.forexfactory.com/showthread.php?t=557430 Starting from here:http://www.forexfactory.com/showthre...98#post8495898
I trade mostly from the hourly charts but break it down to the 5m and even 1m when I spot a potential trade. I am looking for 20 pip BO's risking roughly 5-10 pips at a time. Depending on the BO I can increase my TP if I see potential further movement but this has also got me in trouble in the past and it is part of my strategy that I am looking to analyse here. I watch all majors and a few of the minors but importantly I try to stay away from highly volatile pairs eg GJ unless I can justify a low risk trade. I have found the best time to trade is the Asian session but often stare at the charts for many more hours.
I have no specific rules about drawing my TL's except to say that I am looking for where the price action stops most commonly whether that be the wick or body of the candle. In drawing the TL's, often a pattern becomes apparent which is a big part of my strategy. Common patterns I use are the Wedge, Flag, Cup & Handle, Head & Shoulder, etc.
To identify trade set ups I also use the Trading Made Simple template ( http://www.forexfactory.com/showthread.php?t=291622 ) on hourly charts. I am looking for specific setups with the TDI cross over that's not over bought/sold in the direction to trade and also that isn't running into S/R zones. I will provide an example later. If I identify a TMS trade setup I will go to my normal charts and look for a possible low risk trade.
I am trying to find consistency in my method because I am trying for high risk (leveraged) gains. Each trade I am risking roughly 10% of the current balance. I traded consistently for around 10 weeks at the end of last year but the first 6 weeks I was gaining then losing. I finally figured that it was the highly volatile pairs that were getting me into trouble (GJ, Gold etc) and after I realised this my account grew 1400%. However leading up to the Christmas break I began taking losses so stopped trading believing it was "just the market". I have started trading again this week but am still dismally taking losses. I am beginning to think that a part of the strategy that I was employing during my success is being left out. Perhaps I was using more correlation or maybe I am trading the st charts too much atm or maybe it is just a difficult time to trade being the new year and the NFP week (I have always struggled on this week of the month).
Anyhows, I will be posting my charts when I can but probably wont give too much description in my posts due to time issues unless it is needed. They should be pretty self explanatory. If anyone happens across any of my posts please feel free to ask questions or comment. If people want to post their own TL's on any currency it is always welcome- I often have the same TL on two of the same charts but is a little different in comparison. All angles are good.
Edit (19.2.15): I have started using Harmonics and more awareness of Order Flow with my trading.
Edit (22/9/2015): I am using larger pip R:R, with 2:1 R:R for this strategy: http://www.forexfactory.com/showthread.php?t=557430 Starting from here:http://www.forexfactory.com/showthre...98#post8495898
As the lights go by so too do the shadows move