Hi all, with being a user on FF for a long while, but only being registered for a short time, I have looked over many "systems" so thought it may be time to give you, what I am thinking of giving full time.
It's not easy trading for a living, but in all the threads I've read its worth sharing your "secret" and the reason why is that you think you have the "holy grail" but don't want to give it away, the truth is, everyone has it, their "own belief" but as we all know, what you may see, others see different so here goes to an organic way of improving on what you thought was "great"
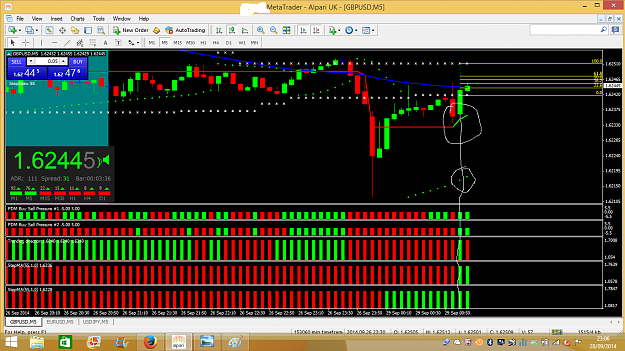
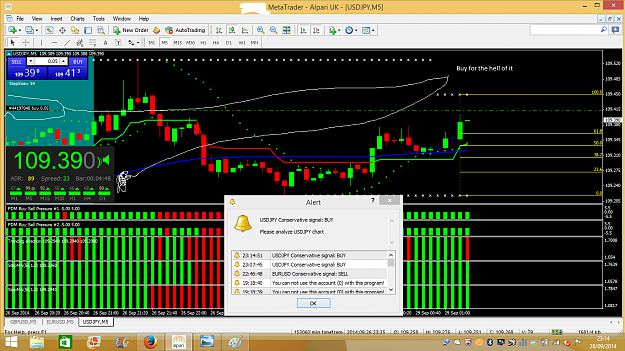
Below is a screen shot of where I am and the "mechanics" behind it.
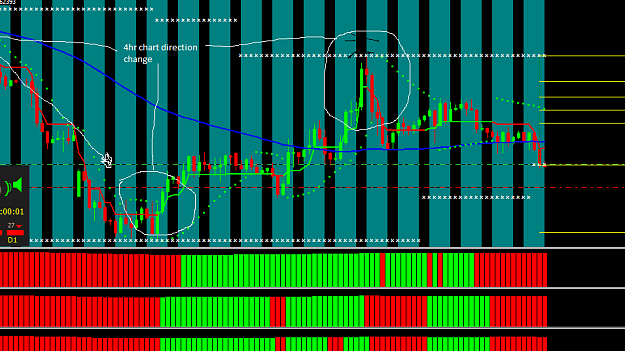
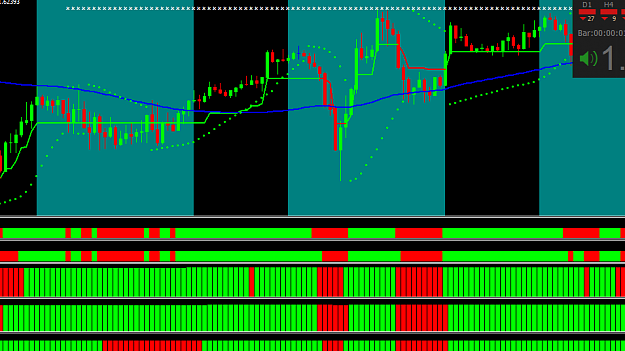
A series of Green and Red candles representing the "ups & downs" of the price, followed by a "Green & Red" step indicator (not my own creation, but used in my own system) followed by 3 histograms, the first being a repainting coloured LSQR indicator and the last two being a modification of the "step line" on the main chart.
The system is simple, the price closes below the step line on the chart, the step line turns red (bar close) and the other indicators are all in alignment (red at bar close) and its a sell position.
The same is true for a buy but all indicators are "green"
Now the tricky bit, some timeframes have great "historical" results but its not that easy, because of repainting (trend direction) its not that simple so its important to view the process and makes some observations before commital.
As always this is not advice and use at your own risk, also any comments on how this could improve will be welcome.
This system is simple and viable, I know, I have made some gains, all said, I have a live account that I have tried other ways untill getting here now, but because of my own work commitments, cannot be at the screen so losses happened, it's expected, but give respect to the system, take a look, best regards, and any Q's, P
It's not easy trading for a living, but in all the threads I've read its worth sharing your "secret" and the reason why is that you think you have the "holy grail" but don't want to give it away, the truth is, everyone has it, their "own belief" but as we all know, what you may see, others see different so here goes to an organic way of improving on what you thought was "great"
Below is a screen shot of where I am and the "mechanics" behind it.
A series of Green and Red candles representing the "ups & downs" of the price, followed by a "Green & Red" step indicator (not my own creation, but used in my own system) followed by 3 histograms, the first being a repainting coloured LSQR indicator and the last two being a modification of the "step line" on the main chart.
The system is simple, the price closes below the step line on the chart, the step line turns red (bar close) and the other indicators are all in alignment (red at bar close) and its a sell position.
The same is true for a buy but all indicators are "green"
Now the tricky bit, some timeframes have great "historical" results but its not that easy, because of repainting (trend direction) its not that simple so its important to view the process and makes some observations before commital.
As always this is not advice and use at your own risk, also any comments on how this could improve will be welcome.
This system is simple and viable, I know, I have made some gains, all said, I have a live account that I have tried other ways untill getting here now, but because of my own work commitments, cannot be at the screen so losses happened, it's expected, but give respect to the system, take a look, best regards, and any Q's, P
Attached Image (click to enlarge)
Attached File(s)