This is a trading strategy based only on RSI indicator. You only need MT4 and this indicator http://www.mql5.com/en/code/10972
I want to make it clear that this is a counter-trend strategy. I know that many of you do not trade against the trend, however with this strategy you are not really aiming for a trend move, but more of a scalp. My target depends on the signal timeframe, the key here is to choose a precise point and also exit early with few pips (depending on timeframe as well). So in a nutshell:
- This is a counter trend strategy
- This strategy is based on selling when market is overbought and buying when market is oversold
- The indicator we use is http://www.mql5.com/en/code/10972 (RSI MTF) plotted in 1min timeframe so you can see the RSI levels in one window without having to go to each timeframe from 1 minute to 1 week timeframe
- You must take a small profit and do not try to pick a top or bottom because markets can stay overbought / oversold for long period. Use stops/positioning If you wish to catch a bigger move and place TP on entry when it start moving in your favour for example.
- Works on all pairs/all timeframes
Before I show you some example trades, including trades that I've taken using this method let me say that :
I know that many will disagree with trading against the trend, but I found for my own trading style that I can pick temporary tops/bottoms with this method and get some pips (Well, the key here is to not be greedy and also be confident about your setup)
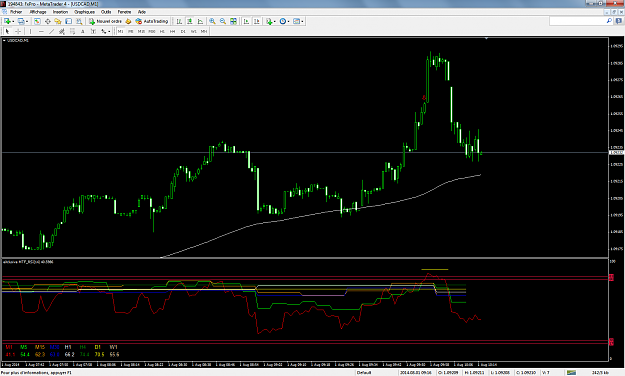
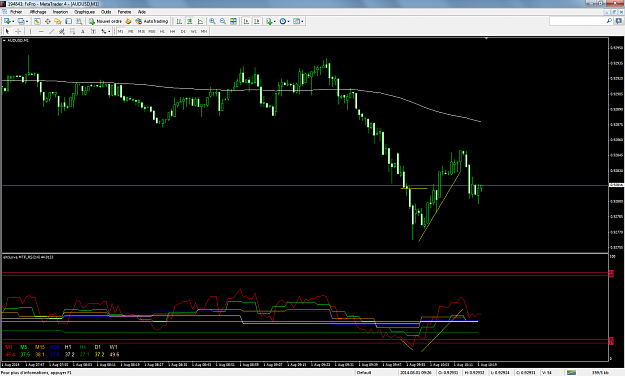
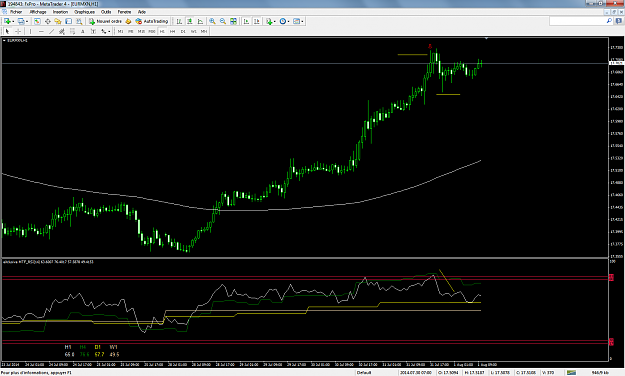
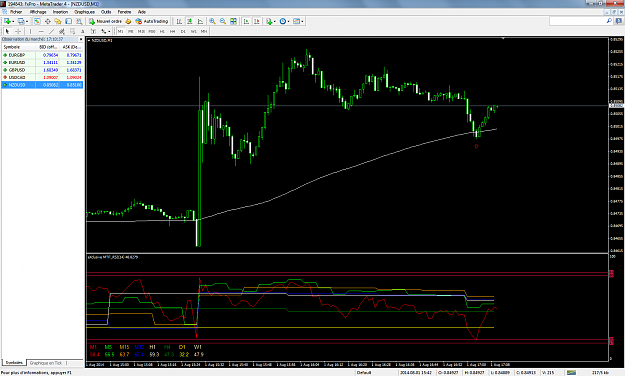
So how a trading signal is generated?
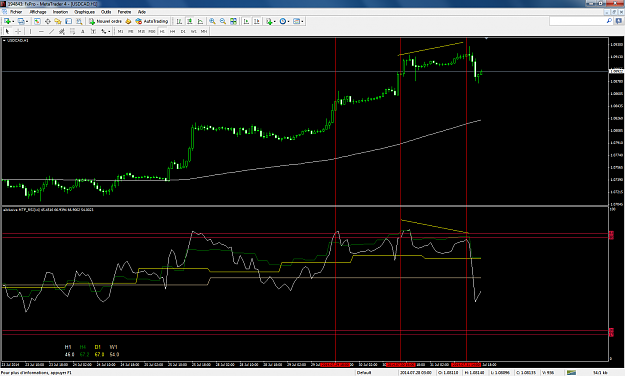
First put the indicator and open 1m chart, it'll show you the RSI levels on all timeframes for that pair. Please also add the levels 20/17, 80/83 to the indicator and make them clearly RED lines so you can see when a pair makes an extreme reading.
I enter long when:
RSI reaches 20 or less I enter long. A better signal is when 2 or more timeframes have the same low RSI reading. A more powerful signal would be a divergence on the chart that suggest our position from that entry.
I enter short when:
RSI reaches 80 or more I enter short. A better signal is when 2 or more timeframes have the same high RSI reading. A more powerful signal would be a divergence on the chart that suggest our position from that entry.
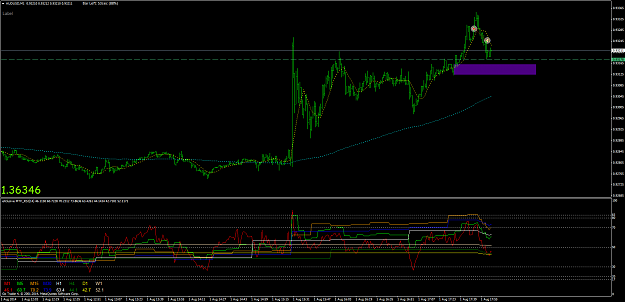
Ok, I believe that charts are worth a lot more than words, so I'll share setups including these I traded this week as well.
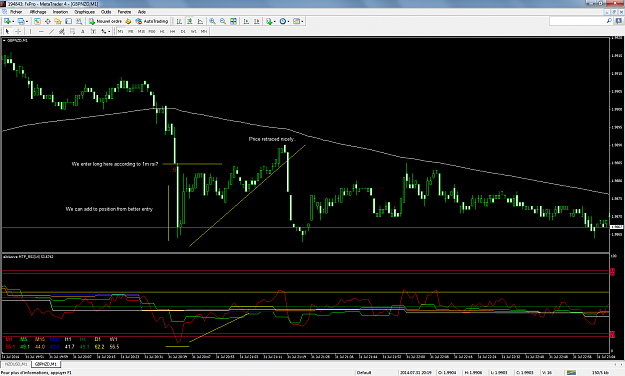
Remember, do not be greedy, one or two reversal candles can be good for you. Do not wait for entire reversal of trend because it needs more than that. Example: If you "feel" or technically studied that it's a top, open two lots the same size and make one TP +10 and the other at BE or like that, you can catch bigger moves or trail stop.
Setup:
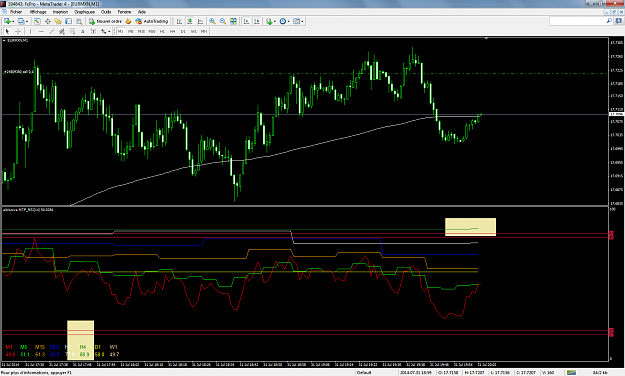
Put exclusive mtf rsi on 1min chart and add levels 20/17/80/83 to it, remove levels 30/70/50. Make the level lines red and clear as they are RSI extremes.
Put a 200 WMA on chart (This is only for guidance, so we can see how far the price went away from the moving average) - Trust me it helps, I have seen in many , many situations how prices try to narrow the distance between this MA and not stay too far away, especially when the market is at extreme. We'll need a good eye to catch clear opportunities.
DO NOT
- Overtrade
- Trade the news
- Trade friday
DO
- Add to position if it moves against you, and stay confident that you can close your positions with a small profit or at least at breakeven.
And you'll do fine
I want to make it clear that this is a counter-trend strategy. I know that many of you do not trade against the trend, however with this strategy you are not really aiming for a trend move, but more of a scalp. My target depends on the signal timeframe, the key here is to choose a precise point and also exit early with few pips (depending on timeframe as well). So in a nutshell:
- This is a counter trend strategy
- This strategy is based on selling when market is overbought and buying when market is oversold
- The indicator we use is http://www.mql5.com/en/code/10972 (RSI MTF) plotted in 1min timeframe so you can see the RSI levels in one window without having to go to each timeframe from 1 minute to 1 week timeframe
- You must take a small profit and do not try to pick a top or bottom because markets can stay overbought / oversold for long period. Use stops/positioning If you wish to catch a bigger move and place TP on entry when it start moving in your favour for example.
- Works on all pairs/all timeframes
Before I show you some example trades, including trades that I've taken using this method let me say that :
I know that many will disagree with trading against the trend, but I found for my own trading style that I can pick temporary tops/bottoms with this method and get some pips (Well, the key here is to not be greedy and also be confident about your setup)
So how a trading signal is generated?
First put the indicator and open 1m chart, it'll show you the RSI levels on all timeframes for that pair. Please also add the levels 20/17, 80/83 to the indicator and make them clearly RED lines so you can see when a pair makes an extreme reading.
I enter long when:
RSI reaches 20 or less I enter long. A better signal is when 2 or more timeframes have the same low RSI reading. A more powerful signal would be a divergence on the chart that suggest our position from that entry.
I enter short when:
RSI reaches 80 or more I enter short. A better signal is when 2 or more timeframes have the same high RSI reading. A more powerful signal would be a divergence on the chart that suggest our position from that entry.
Ok, I believe that charts are worth a lot more than words, so I'll share setups including these I traded this week as well.
Remember, do not be greedy, one or two reversal candles can be good for you. Do not wait for entire reversal of trend because it needs more than that. Example: If you "feel" or technically studied that it's a top, open two lots the same size and make one TP +10 and the other at BE or like that, you can catch bigger moves or trail stop.
Setup:
Put exclusive mtf rsi on 1min chart and add levels 20/17/80/83 to it, remove levels 30/70/50. Make the level lines red and clear as they are RSI extremes.
Put a 200 WMA on chart (This is only for guidance, so we can see how far the price went away from the moving average) - Trust me it helps, I have seen in many , many situations how prices try to narrow the distance between this MA and not stay too far away, especially when the market is at extreme. We'll need a good eye to catch clear opportunities.
DO NOT
- Overtrade
- Trade the news
- Trade friday
DO
- Add to position if it moves against you, and stay confident that you can close your positions with a small profit or at least at breakeven.
And you'll do fine