This thread will focus on how Real Volume and Transactions indicators can be used for trading in the forex market.
However, there are notable differences when there is a large spike in real trading volume. This reveals a limitation with tick volume in that it has no way of showing when a large amount of volume trades at a single price, since that would only be counted as a single tick. Real Volume and Transactions indicators can thus provide new perspectives on what traders are doing during major news events, especially since they work even on 1-minute charts.
To summarize:
- Free download for Trading Station charts
- Twice-daily updates www.dailyfx.com/volume
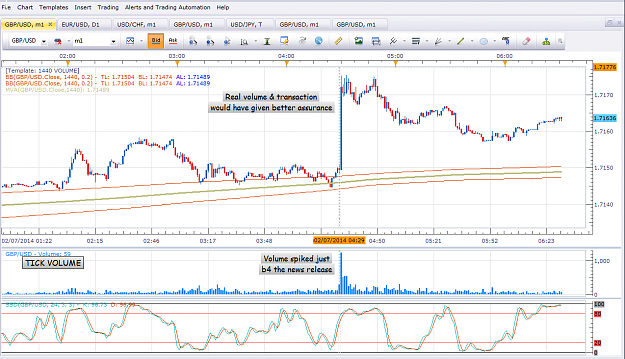
Real Volume and Transactions indicators used to be hard to come by for forex traders. Previously, we had to make do with approximations such as tick volume which, while useful, only tell part of the story. As you can see from a 1-minute chart below of the recent ECB announcement there's definitely a correlation between Real Volume (top), Tick Volume (middle) and Transactions Volume (bottom).
http://i.imgur.com/nnSJFpR.png
However, there are notable differences when there is a large spike in real trading volume. This reveals a limitation with tick volume in that it has no way of showing when a large amount of volume trades at a single price, since that would only be counted as a single tick. Real Volume and Transactions indicators can thus provide new perspectives on what traders are doing during major news events, especially since they work even on 1-minute charts.
To summarize:
- Real Volume shows you how many currency units traded
- Transactions show you how many client orders executed
- Tick Volume shows you how many times the price updated
While each of them can be valuable in its own way, this discussion will focus on Real Volume and Transaction indicators, since this information is new in retail forex.