PLEASE NOTE ALL TRADES ARE DEMO AND IM JUST TESTING THE IDEA UNIT OTHERWISE STATED.
-----------------------------------------------------------------------------------------------------------------------------------------------------------------------------------------------------
Hi all.
This is far from a mechanical system but is very basic.
Basically trade a bounce or a break of the Tenkan-sen line that is apart of the Ichimoku Kinko Hyo. Just basic PA reading really
The definition and explanation of the Non-cloud thingy / line is the following according to investopidia
"
Definition of 'Tenkan-Sen'
The mid-point between the highest high and lowest low of a particular security calculated over the past nine periods. The Tenkan-Sen line is the conversion line used specifically in the Ichimoku Kinko Hyo (or Ichimoku Cloud) equilibrium charts. Along with the 26-period moving average, Kijun-Sen, it is one of two moving average lines displayed in the chart.
This line is calculated by using the following formula:
http://i.investopedia.com/inv/dictio...tenkansen1.gif
The resulting line is interpreted in the same manner as a short-term moving average.
Also known as "Tenkan-Sen line" or simply "Tenkan line".
Investopedia explains 'Tenkan-Sen'
The Tenkan-Sen is generally used in combination with the Kijun-Sen to create predications of future momentum. A buy signal is created when the Tenkan-sen line moves above the Kijun-Sen, while a sell signal is created when the Tenkan-Sen line moves below the Kijun-Sen line.
Many technical traders use the Tenkan-Sen as a tool for predicting levels where the price of the asset will find short-term support.
When reading Ichimoku Kinko Hyo charts, investors should note that the Tenkan-Sen line leads the Kijun-Sen, and tracks price with more sensitivity because it covers a shorter period of time. When the Tenkan-Sen line crosses and moves above the Kijun-Sen line, this is generally considered a bullish signal. Alternatively, when the Tenkan-Sen line crosses below the Kijun-Sen line, it is considered a bearish signal.
"
Exits premature and just need to get a pick up to show examples
Ideal trade/day
I have been wrestling with the idea for while and will now be perusing it and doing some forward testing.
I will be adding indicators , pivots and so on in future if need be.Right now just concentrating on the Yellow line
Some help if you can.........
Does anyone know of something similar that has already explored this option?(trading without the cloud)
---------------------------------------------------------------------------------------------------------------------------------------------------------------------------------------------------
RULES
Dont be the idiot that comes here to debate the idea or the system (this is not lets have a debate/argument thread )
)
Please post charts of Entries and Exits that are clearly marked
Hope I dont have to add more rules.I mean we are all grow up people aren't we.Basic respect is all that is needed.
----------------------------------------------------------------------------------------------------------------------------------------------------------------------------------------------------
Please post if you do take a trade or have an idea.:nerd:
Good luck and happy pipping
Rooi

I will update indicators and Template as we go along (Remember you can always use the paperclip sign on the top right to search for attachments )
-----------------------------------------------------------------------------------------------------------------------------------------------------------------------------------------------------
Hi all.
This is far from a mechanical system but is very basic.
Basically trade a bounce or a break of the Tenkan-sen line that is apart of the Ichimoku Kinko Hyo. Just basic PA reading really
The definition and explanation of the Non-cloud thingy / line is the following according to investopidia
"
Definition of 'Tenkan-Sen'
The mid-point between the highest high and lowest low of a particular security calculated over the past nine periods. The Tenkan-Sen line is the conversion line used specifically in the Ichimoku Kinko Hyo (or Ichimoku Cloud) equilibrium charts. Along with the 26-period moving average, Kijun-Sen, it is one of two moving average lines displayed in the chart.
This line is calculated by using the following formula:
http://i.investopedia.com/inv/dictio...tenkansen1.gif
The resulting line is interpreted in the same manner as a short-term moving average.
Also known as "Tenkan-Sen line" or simply "Tenkan line".
Investopedia explains 'Tenkan-Sen'
The Tenkan-Sen is generally used in combination with the Kijun-Sen to create predications of future momentum. A buy signal is created when the Tenkan-sen line moves above the Kijun-Sen, while a sell signal is created when the Tenkan-Sen line moves below the Kijun-Sen line.
Many technical traders use the Tenkan-Sen as a tool for predicting levels where the price of the asset will find short-term support.
When reading Ichimoku Kinko Hyo charts, investors should note that the Tenkan-Sen line leads the Kijun-Sen, and tracks price with more sensitivity because it covers a shorter period of time. When the Tenkan-Sen line crosses and moves above the Kijun-Sen line, this is generally considered a bullish signal. Alternatively, when the Tenkan-Sen line crosses below the Kijun-Sen line, it is considered a bearish signal.
"
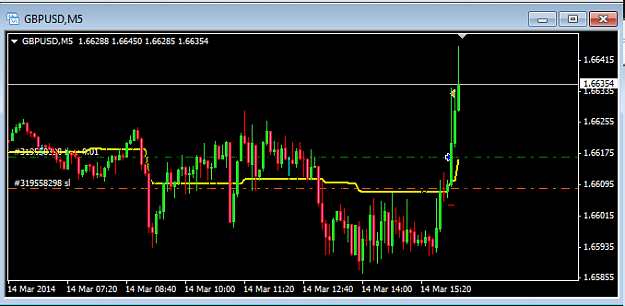
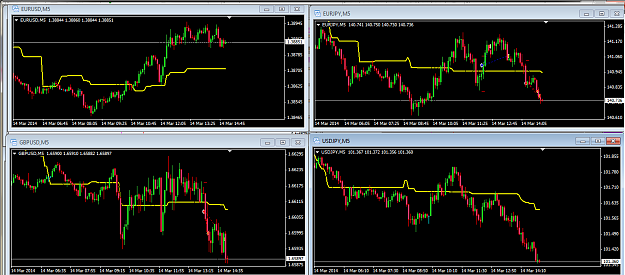
Exits premature and just need to get a pick up to show examples
Attached Image (click to enlarge)
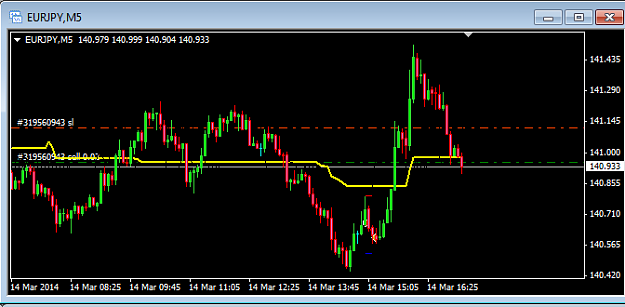
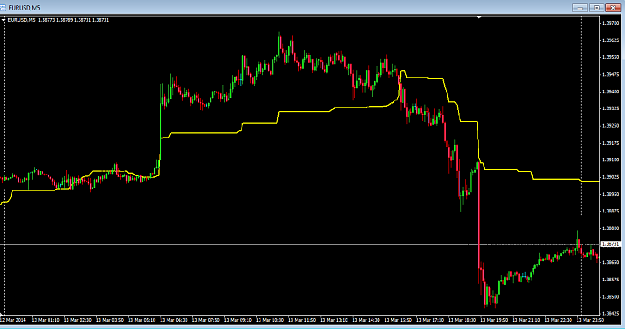
Ideal trade/day
Attached Image (click to enlarge)
I have been wrestling with the idea for while and will now be perusing it and doing some forward testing.
I will be adding indicators , pivots and so on in future if need be.Right now just concentrating on the Yellow line
Some help if you can.........
Does anyone know of something similar that has already explored this option?(trading without the cloud)
---------------------------------------------------------------------------------------------------------------------------------------------------------------------------------------------------
RULES
Dont be the idiot that comes here to debate the idea or the system (this is not lets have a debate/argument thread
Please post charts of Entries and Exits that are clearly marked
Hope I dont have to add more rules.I mean we are all grow up people aren't we.Basic respect is all that is needed.
----------------------------------------------------------------------------------------------------------------------------------------------------------------------------------------------------
Please post if you do take a trade or have an idea.:nerd:
Good luck and happy pipping
Rooi
I will update indicators and Template as we go along (Remember you can always use the paperclip sign on the top right to search for attachments )
Attached File(s)
We miss 100% of the shots we don't take