Hi all,
I decided to start a journal with a method that suits my style of trading and doesn't involve any indicators, just a bit of general trading 'common sense', respecting previous SR and putting some fibs on a recent move.
I am trading, amongst other, the EURJPY using a Renko chart in a different way to the norm.
Rather than set a Renko chart up to have 1 box equal to a number of pips (10,20,50 whatever), with the attached indicator I can almost 'tape trade'
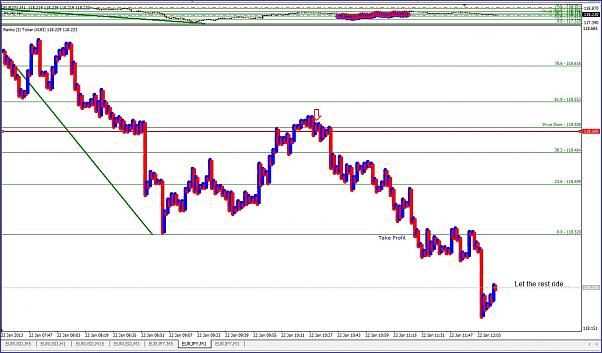
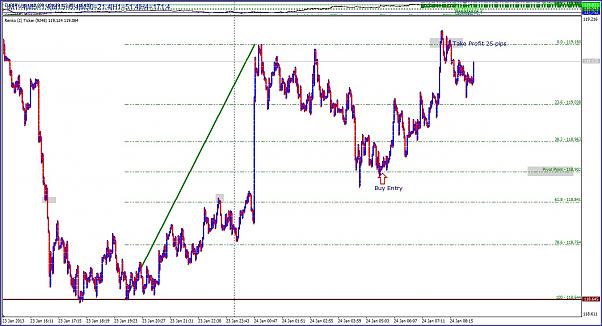
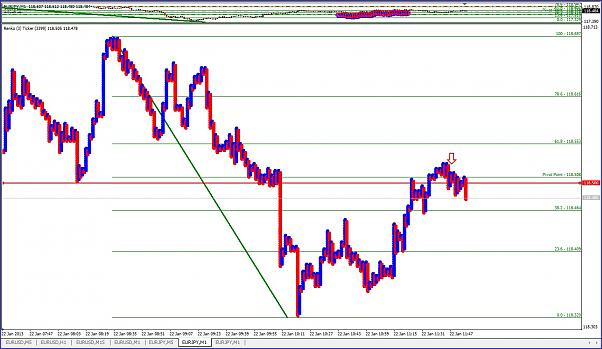
The chart below is set with the Renko chart settings: BoxSize 3, BoxWidth 8 (this can be less to more to suit your eyes! The lower number the narrower each box drawn will be). I open the M1 EURJPY chart and add the Renko Ticker. I then move the indicator to take up most of the screen as you can see.
Please ignore the times on the chart as this is NOT the time of the move as the Renko chart does not move with the candles in the minized candle chart at the top.
There was a down 'trend' from 118.67 (11:15am to check your charts) to 118.382 (at 11:35).
On noticing this was retracing I then put the standard fibs on the indicator chart as you can see.
The 118.50 level looked very interesting as it was virtually bang on the 50% retracement level of the down move and also had some 'previous' with the down move. As the down move had broken this level I was expecting it to be a resistance level to the current retracement.
So I went short with a 12 pip SL.
I decided to start a journal with a method that suits my style of trading and doesn't involve any indicators, just a bit of general trading 'common sense', respecting previous SR and putting some fibs on a recent move.
I am trading, amongst other, the EURJPY using a Renko chart in a different way to the norm.
Rather than set a Renko chart up to have 1 box equal to a number of pips (10,20,50 whatever), with the attached indicator I can almost 'tape trade'
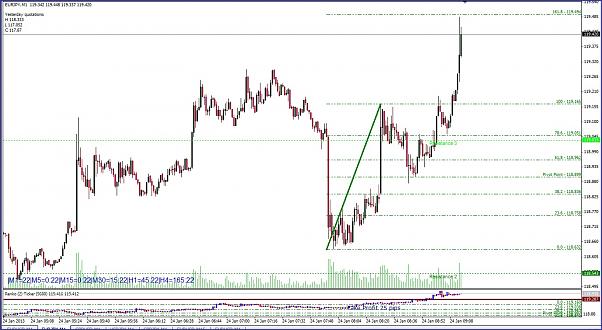
The chart below is set with the Renko chart settings: BoxSize 3, BoxWidth 8 (this can be less to more to suit your eyes! The lower number the narrower each box drawn will be). I open the M1 EURJPY chart and add the Renko Ticker. I then move the indicator to take up most of the screen as you can see.
Please ignore the times on the chart as this is NOT the time of the move as the Renko chart does not move with the candles in the minized candle chart at the top.
There was a down 'trend' from 118.67 (11:15am to check your charts) to 118.382 (at 11:35).
On noticing this was retracing I then put the standard fibs on the indicator chart as you can see.
The 118.50 level looked very interesting as it was virtually bang on the 50% retracement level of the down move and also had some 'previous' with the down move. As the down move had broken this level I was expecting it to be a resistance level to the current retracement.
So I went short with a 12 pip SL.
Attached Image (click to enlarge)
Attached File(s)