►►Financial Markets Observatory Lab.◀◀
❖ H! ALL ❖
Some notes/charts about Global Stocks-Market.
General stocks-benchmarks as follows:
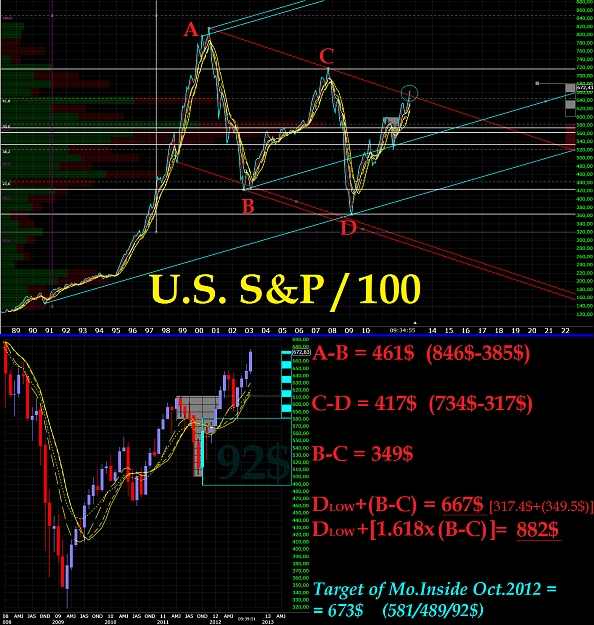
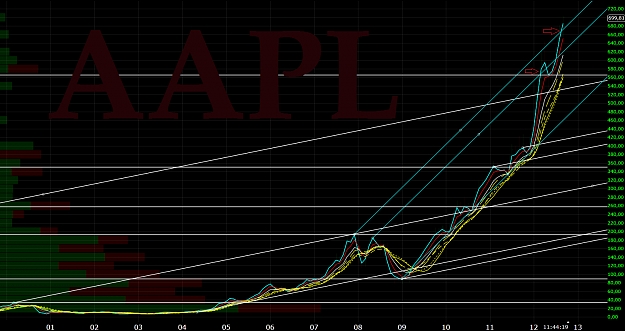
► main U.S. stocks-benchmarks (charts & notes: QQQ; ONEQ; DIA; OEF; SPY);
► global U.S. stocks-benchmarks (charts & notes: EUSA; ISI; IWB; IWV; IYY; TMW);
► global World stocks-benchmarks (charts & notes: ACWI; DGT; IOO; NYSE W.L.I.; ONEF; VT).
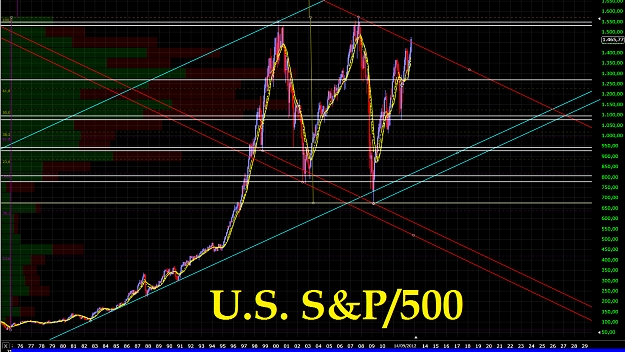
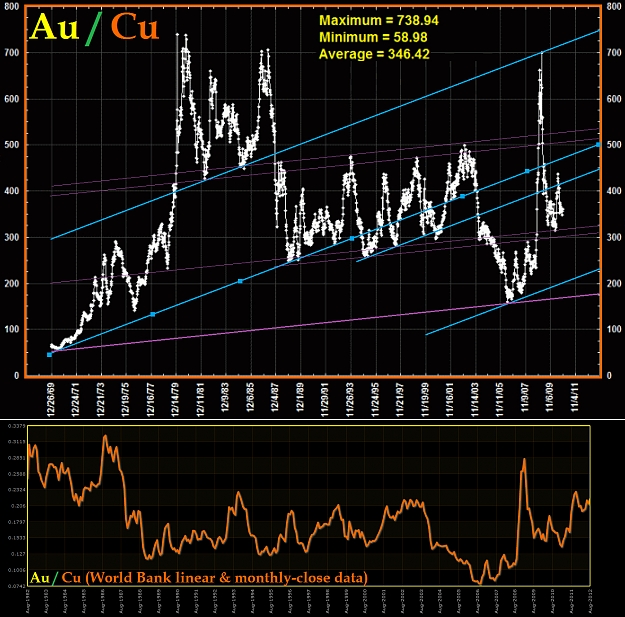
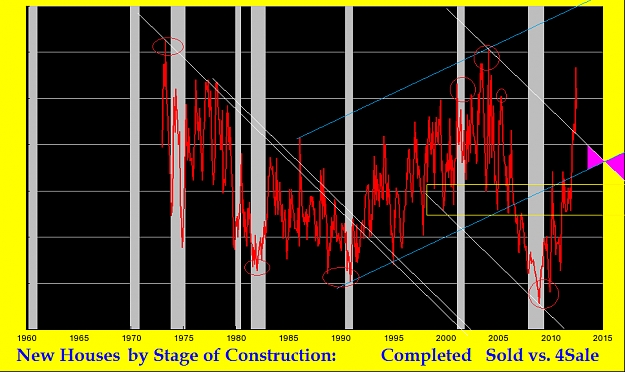
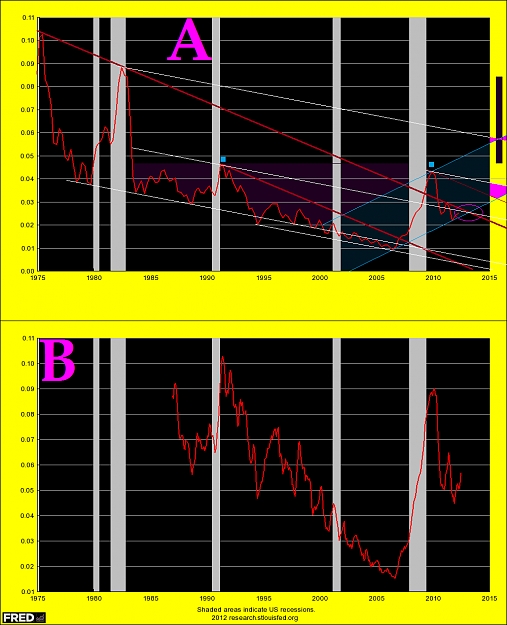
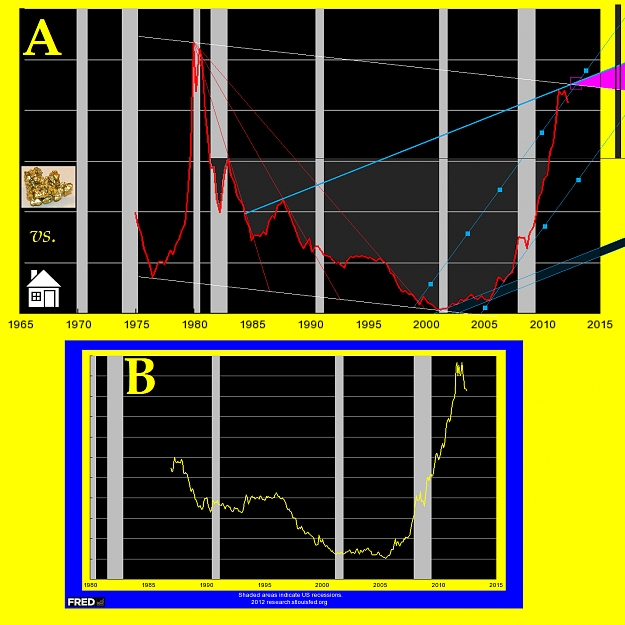
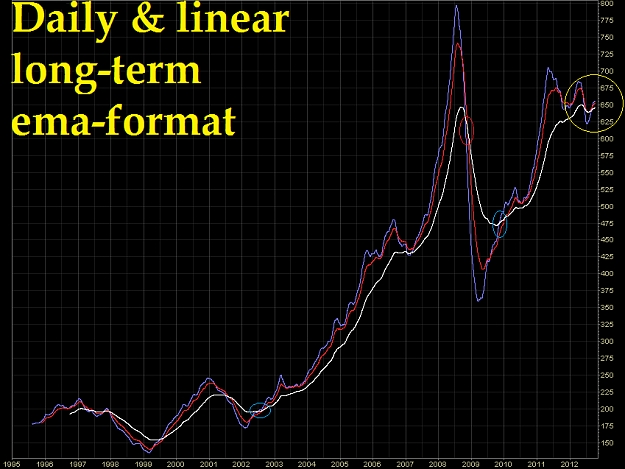
Chart I (linear & monthly candles-format) as U.S. S&P/500 Ind (a megalithic neverending diamond ???).
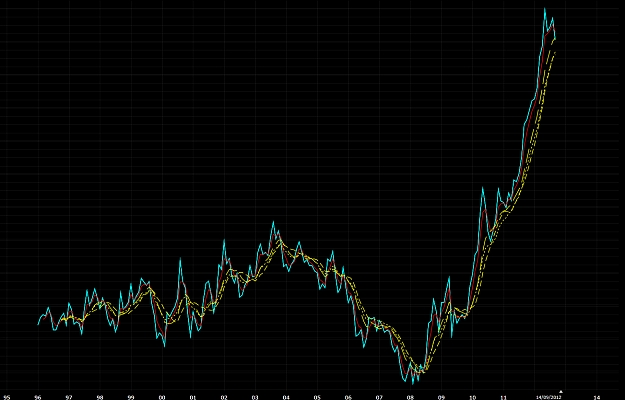
Chart II (linear & weekly ema-format) as r-spread vs. NYSE World Leading Ind.
Yellow-lines as Multiple 10mo. average: sma, ema, fwma, vwma, triangular-ma, Wilders-ma.
Follows also the Jenuary rule of Gann and the December Low Rule, for these benchmarks.
Sorry for my bad English. I hope that this post is at least minimally useful.
☻/ ❖ Globo.pk, Alert 2.O !!! ❖
/▌
/|
Tuned on main trend, but follows short-medium term signs from underlying prices, for a correct & real-time set-up.
It is very important do not anticipate the main trend of the underlying financial instruments.
Ⓘℳ☢ ℬɣ $@❣♆¥ ►►♥
₭€$AⅅⅅhAPhA'pe'₭AℳℙA' ℬunda-ℬunda €MP¥R€ ❣❣❣
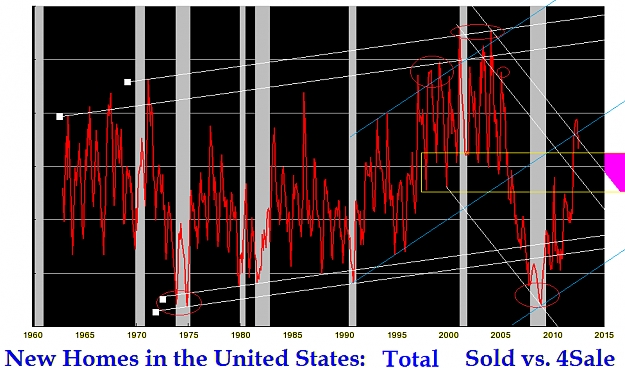
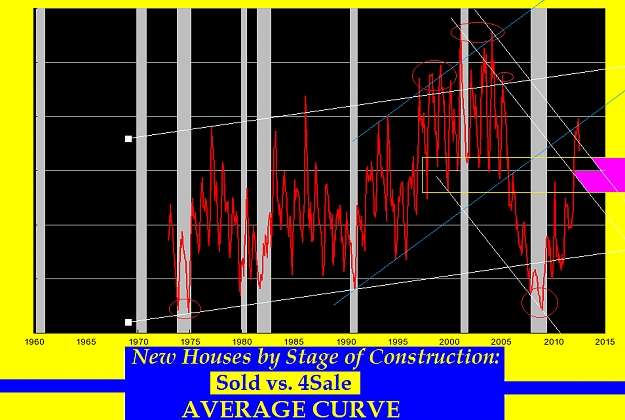
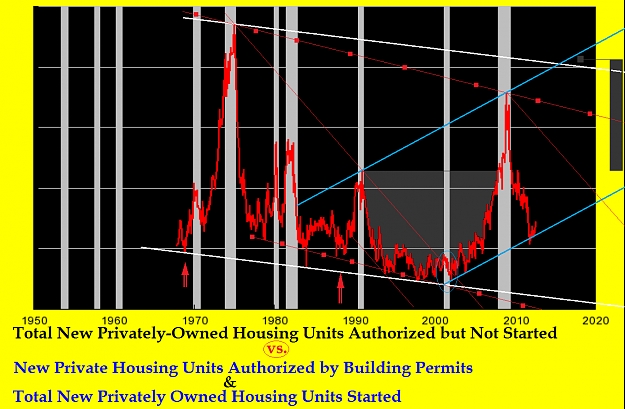
Attached Image(s) (click to enlarge)