Hello all.
I would like to bring forward as a strategy for trading commodities, FOREX, stocks, or any markt driven trading vehicle.
This is called The SAFT Strategy which stands for Strength Analysis Forex Trading. This is a strategy that looks to follow the strength of a price action movement and make a decision based on techincal break points of trend and momentum to determine the turning points of a price action. This strategy is designed to be counter trend and is looking for levels where the existing price action trend is broken and a directional change occurs.
To better understand this strategy it is important to first understand the entire system in totality using a ratio based system by which one grows their account balance based on percentage of account balance as risk, growth plan, win-loss ratios, and take profit or exit strategy.
Before I move into the exact parts of the method it is necessary to setup the strategy where the account growth schedule, order size, account protection and stoploss, indikators - order entry, money managment, and exit strategy are all created to maximize ones profits and minimize ones losses.
Part 1: Account Growth Schedule
The SAFT Strategy is setup on a basic 2 wins per 1 loss ratio. Therefore as one places an order one look to make twice the amount as one risks in each and every trade. Looking at this in statistical terms SAFT is designs on the following basic ratios. If we look at a 50% win and 50% loss ratio we can see that at a 2 to 1 win ratios one still makes profit.
(100 Trades 0.10 lotsize)
2 to 1
Wins....50%....50 trades.......... 100$
Losses..50%...50 trades.......... 50$
======
Profit 50$
Now, I am not saying that SAFT will win only 50% of the time. In tests and trial ''live'' accounts SAFT averages a 76% wins to 24% loss ratio. But as you can see by the above ratio even at a 50% success rate one does make money.
Also, let me clarify even further, I qualify a loosing trade as a trade where the stoploss is hit and a winning trade where the take profit is hit. Because I practice a dynamic stoploss system most of my loss trades are actually in-profit trades because the stoploss moves quickly to protect the order.(discussed in part 3)
Now applying this basic formula into a growth strategy of 5% weekly one looks to always grow ones account by 5% weekly. This slower growth schedule based out over a 104 week period (2 years) can provide one with tremendious results at the end of that period if one follows all the components of the SAFT method. (attached spreadsheet)
Part 2: Order Entry Size (lotsize)
It is important to maintain a proper Account Balance Ratio System (ABRS) based on the size of ones total account balance. This is to ensure that ones account does not get overextended and one suffers significant account losses or even a margin call on account causing one to lose all tradable capital in account. Additionally, it is equally important to maintain an order sizing scheme by which ones account has large enough returns to make the trade reward worth the risk of entering the markt in the first place. Therefore, a proper Account Balance Ratio System (ABRS) was important to be developed to satisfy these needs. To properly do this one need to establish a ratio system based on the 1000 basis ratio rule.
ABRS basically states that for every 1000 in an account will be equal to one trade lot allowance of 0.10 lot. Therefore the maximum total trades for a 1000 account would be 0.10 lot(s). Based on this system you would maintain the following ratios.
ABRS Ratio System
1000 equals 0.10 lot(s)
2000 equals 0.20 lot(s)
3000 equals 0.30 lot(s)
4000 equals 0.40 lot(s)
5000 equals 0.50 lot(s)
6000 equals 0.60 lot(s)
7000 equals 0.70 lot(s)
8000 equals 0.80 lot(s)
9000 equals 0.90 lot(s)
10000 equals 1.00 lot(s)
etc….
Part 3: Stoploss and Account Balance Protection (ABP)
Before I discuss the entry of a trade I want to start backwards and talk about stoplosses for a trade and Account Balance Protection (ABP). In the SAFT Strategy the basic stoploss is very simple. When placing an order all stoplosses begin at the last major swing low or swing high of the recient price action movement. Therefore, the actual value or pips loss will vary based on the degree of price action movement. Some orders may have a Stoploss of 80 pips and other may be as small as 15 pips but on average the stoploss in the 15 min timeframe is generally 32pips behind the order.
However, this is only a temporary phase of the life of a trade order using the SAFT method because in SAFT one needs to learn and religiously practice a DYNAMIC STOPLOSS SYSTEM.
(Dynamic Stoploss)
The key is to protect your orders as much and as soon as possible in effort to minimize losses and maximize gains. Therefore, once the pip count exceeds 30pips positive (market moves 30pips in your favor) or 1X ones stoploss, move the stoploss to 3pips in front of the order to protect from having any loss on the trade. This will ensure you have atleast a 3 pip profit if there is a sudden change in market conditions.
For example, say the swing low/high was 15 pips which is your stoploss on an order. In this instance the price action moves 16 pips and not the fixed 30 pips. Because the price action has moved the stoploss size you would again move your stoploss to +3 pips versus waiting for a 30 pips move because your order has already reached the 50% level of the life of that order and ones objektive is always to protect the overall account balance.
Yes, in whipsaw action one may get stopped out more often but in those cases it usually means the market is not ready to move in the direction of your order and you can wait on new pricing action that normally means a second entry order is soon to come at a better price than the first because the market was simply not ready.
Part 4: Indikators - Order Entry
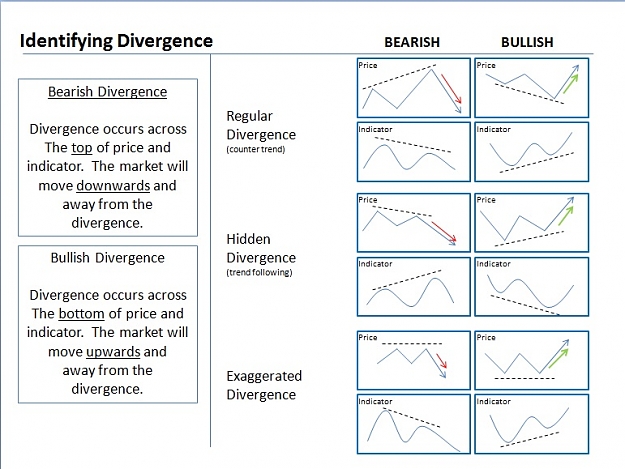
SAFT is a very basic system setup on the premise of price action trend, divergence, and momentum. SAFT uses only one basic indikator, the traders ability to draw trendlines, and another addon indikator as a signal to tell one it is time to draw trendlines and begin looking for price action directional change.
The indikator the SAFT Strategy uses is the most basic of indikators and is included in the standard Metatrader. The indikator is the On Balance Volume indikator.
On Balance Volume (OBV) measures buying and selling pressure as a cumulative indicator that adds volume on up days and subtracts volume on down days. OBV was developed by Joe Granville and introduced in his 1963 book, Granville's New Key to Stock Market Profits. It was one of the first indicators to measure positive and negative volume flow. Chartists can look for divergences between OBV and price to predict price movements or use OBV to confirm price trends.
Calculation
The On Balance Volume (OBV) line is simply a running total of positive and negative volume. A period's volume is positive when the close is above the prior close. A period's volume is negative when the close is below the prior close.
If the closing price is above the prior close price then:
Current OBV = Previous OBV + Current Volume
If the closing price is below the prior close price then:
Current OBV = Previous OBV - Current Volume
If the closing prices equals the prior close price then:
Current OBV = Previous OBV (no change)
This indikator determines the price action momentum of a price action movement. One know can see the strength of whether the BULLS or the BEARS control the markt price action.
Basic Order entry criterea:
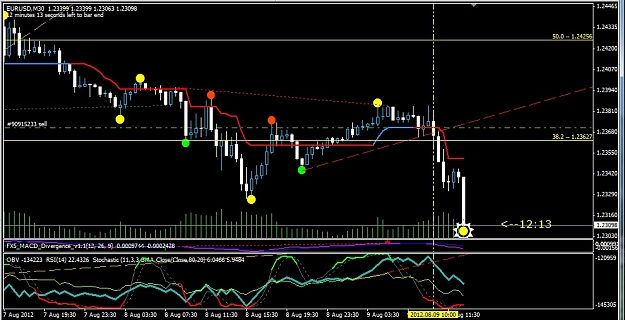
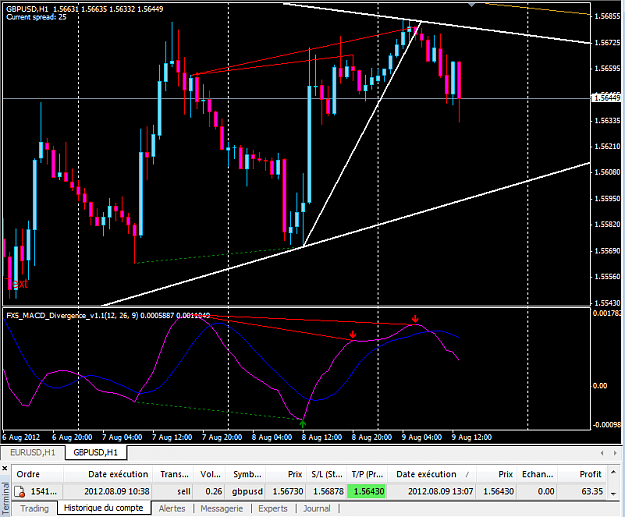
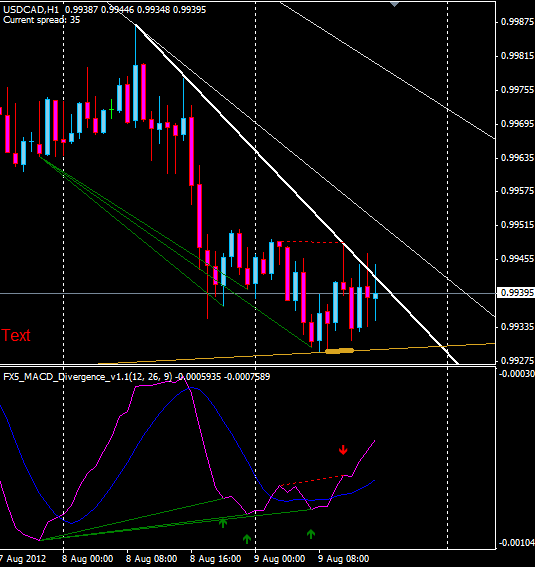
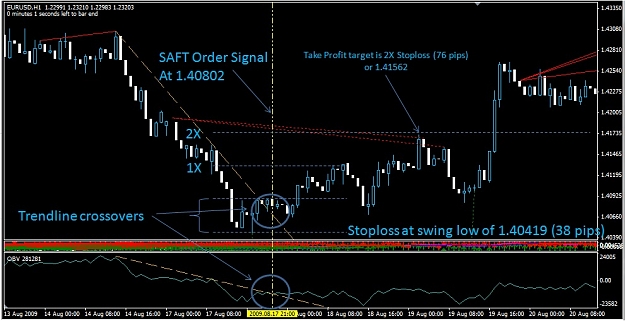
One can draw then draw the proper trendline connecting the tops in a downtrend or bottoms in an uptrend on both the price action and OBV indikators. Once the trendlines in both parts are broken that is the point an entry order is made. (see screenshot)
Additionally, the stoploss will be assigned at the last swing low/high of the price action. The target take profit level is 2X the size of the stoploss initially set. (see screenshot)
-----------------------------------------------------------------------------------------------------------------------------------------------------
(EDIT July 2012 addon indikator)
Addon indikator; in addition divergence in price action is a key sign that price action is in the process of directional change. Therefore an add on indikator I have found to be useful is the FX5 MACD Divergence indikator. This indikator will begin to draw divergence lines as criterea is met by the indikator that show possible divergence. However, I only use this indikator as an early warning that it is time for one to begin looking at the charts to draw ones own trendlines and begin looking for entry points. Also, sometimes the trendline direction for a trade that I am looking to place an order may be opposite what the indikator shows. In any case I have found this indikator is an excellent early warning tool to alert one on when one should begin looking at the charts to construct trendlines and looking for breaks as price action and momentum change direction. (attachment in post #1)
(EDIT 15 Aug 2012 possible addon indikator)
To addon to the discussions on a good indikator to help in drawing trendlines one could use one of the following..zigzag, semafor, fractals, or high/low. However, I have been testing and a indikator that I do like to help with trendlines is a indikator called DeMark Trendline Trader. I think it does a fairly good job but the disadvantage is that it immediatly removes the past lines when it draws new one. I like having a few of the past lines in drawing trendlines so for my manual is my preferred. However, this indikator does a good job and provides one both a upside and downside trendline to choose from. For my OBV is always going to be the decider on markt direktion.
(see attachments in post #1 for this indikator)
(EDIT 19 Aug 2012 SAFT using MA lines versus drawing trendlines)
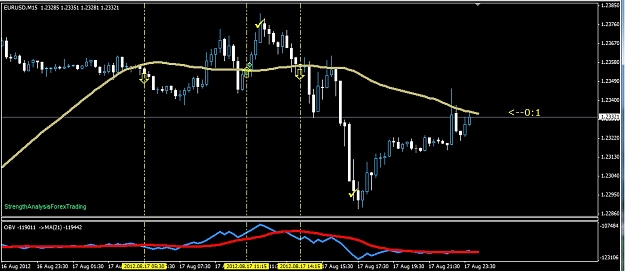
It has been discussed and discovered that using MA line crosses applied to price action and the OBV indikator does a very close representation to drawing the trendlines manually and then looking for the breaks to trigger an order. I have therfore attached to this post the ''strengthanalysisforextrading template.tpl'' that does a great job at obtaining the same conclusions as using manual drawn trendlines and look for crosses. HOWEVER, due to lack of liquidity during the asian sessions I recommend NOT using this during asian markt times.
-----------------------------------------------------------------------------------------------------------------------------------------------------
Part 5: Money Managment, and Exit Strategy
Proper Money Management skills are essential to becoming a successful trader. Money Management is by far the most important skill to master. Money management is simply a management skill incorporate that will effectively preserve capital while you increase your profits. In other words a good system will help keep you from losing all of your money and help you make money.
One of the most difficult tasks a trader has is when to take profit. Knowing when and where to take ones profit can make all the difference because know when to take that profit can turn a very profitable order in to a no profit or lossing order. Therefore it is very important to know WHEN TO EXIT A TRADE. Here are three exit strategies that I use with SAFT to determine which level of risk one is willing to tolerate while at the same time increasing ones account balance to meet the goals of the growth schedule.
Exit Strategy 1 (most conservative)
Once an order has been initiated and the target of 2X stoploss has been identified one sets a take profit in the MetaTrader and takes the full profit of the order as the target level is reached.
Exit Strategy 2 (moderate balance)
Once an order has been initiated and the target 2X stoploss has been identifies one watches the order and removes 1/2 of the order size as the target ''take profit'' level is reached. The remaining 2/2 of the order remains and a trailing stoploss is assigned to the order that is the same size as the original stoploss of the order. The the order is allowed to run until the price action reaches a level where one has a counter signal or the stoploss is hit.
Exit Strategy 3 (most agresssive)
Once an order has been initiated and the target 2X stoploss has been identified and reached; a trailing stoploss is assigned to the order that is the same size as the original stoploss of the order. The the order is allowed to run until the price action reaches a level where one has a counter signal or the stoploss is hit.
SAFT System Usage:
The SAFT System can be used in any currency pair, commodity, futures, or stocks trading markts. The SAFT System can be used in virtually any timeframe however, I have found that timeframes lower than 15 mins are prone to more unpredictable moves as the lower timeframes are more prone to exaggerated moves with in a larger timeframe and the larger timeframes tend to have more stable an predictable price action movements.
CONCLUSION:
It is my belief that if one uses the SAFT System with consistancy and discipline one can easily begin to grow ones account in a consistant manner. The level of success will vary based on ones risk tolerence and skill level but one should be able to profit overall if all the parts of the SAFT System are utilized equally.
Evaluator.:nerd:
I would like to bring forward as a strategy for trading commodities, FOREX, stocks, or any markt driven trading vehicle.
This is called The SAFT Strategy which stands for Strength Analysis Forex Trading. This is a strategy that looks to follow the strength of a price action movement and make a decision based on techincal break points of trend and momentum to determine the turning points of a price action. This strategy is designed to be counter trend and is looking for levels where the existing price action trend is broken and a directional change occurs.
To better understand this strategy it is important to first understand the entire system in totality using a ratio based system by which one grows their account balance based on percentage of account balance as risk, growth plan, win-loss ratios, and take profit or exit strategy.
Before I move into the exact parts of the method it is necessary to setup the strategy where the account growth schedule, order size, account protection and stoploss, indikators - order entry, money managment, and exit strategy are all created to maximize ones profits and minimize ones losses.
Part 1: Account Growth Schedule
The SAFT Strategy is setup on a basic 2 wins per 1 loss ratio. Therefore as one places an order one look to make twice the amount as one risks in each and every trade. Looking at this in statistical terms SAFT is designs on the following basic ratios. If we look at a 50% win and 50% loss ratio we can see that at a 2 to 1 win ratios one still makes profit.
(100 Trades 0.10 lotsize)
2 to 1
Wins....50%....50 trades.......... 100$
Losses..50%...50 trades.......... 50$
======
Profit 50$
Now, I am not saying that SAFT will win only 50% of the time. In tests and trial ''live'' accounts SAFT averages a 76% wins to 24% loss ratio. But as you can see by the above ratio even at a 50% success rate one does make money.
Also, let me clarify even further, I qualify a loosing trade as a trade where the stoploss is hit and a winning trade where the take profit is hit. Because I practice a dynamic stoploss system most of my loss trades are actually in-profit trades because the stoploss moves quickly to protect the order.(discussed in part 3)
Now applying this basic formula into a growth strategy of 5% weekly one looks to always grow ones account by 5% weekly. This slower growth schedule based out over a 104 week period (2 years) can provide one with tremendious results at the end of that period if one follows all the components of the SAFT method. (attached spreadsheet)
Part 2: Order Entry Size (lotsize)
It is important to maintain a proper Account Balance Ratio System (ABRS) based on the size of ones total account balance. This is to ensure that ones account does not get overextended and one suffers significant account losses or even a margin call on account causing one to lose all tradable capital in account. Additionally, it is equally important to maintain an order sizing scheme by which ones account has large enough returns to make the trade reward worth the risk of entering the markt in the first place. Therefore, a proper Account Balance Ratio System (ABRS) was important to be developed to satisfy these needs. To properly do this one need to establish a ratio system based on the 1000 basis ratio rule.
ABRS basically states that for every 1000 in an account will be equal to one trade lot allowance of 0.10 lot. Therefore the maximum total trades for a 1000 account would be 0.10 lot(s). Based on this system you would maintain the following ratios.
ABRS Ratio System
1000 equals 0.10 lot(s)
2000 equals 0.20 lot(s)
3000 equals 0.30 lot(s)
4000 equals 0.40 lot(s)
5000 equals 0.50 lot(s)
6000 equals 0.60 lot(s)
7000 equals 0.70 lot(s)
8000 equals 0.80 lot(s)
9000 equals 0.90 lot(s)
10000 equals 1.00 lot(s)
etc….
Part 3: Stoploss and Account Balance Protection (ABP)
Before I discuss the entry of a trade I want to start backwards and talk about stoplosses for a trade and Account Balance Protection (ABP). In the SAFT Strategy the basic stoploss is very simple. When placing an order all stoplosses begin at the last major swing low or swing high of the recient price action movement. Therefore, the actual value or pips loss will vary based on the degree of price action movement. Some orders may have a Stoploss of 80 pips and other may be as small as 15 pips but on average the stoploss in the 15 min timeframe is generally 32pips behind the order.
However, this is only a temporary phase of the life of a trade order using the SAFT method because in SAFT one needs to learn and religiously practice a DYNAMIC STOPLOSS SYSTEM.
(Dynamic Stoploss)
The key is to protect your orders as much and as soon as possible in effort to minimize losses and maximize gains. Therefore, once the pip count exceeds 30pips positive (market moves 30pips in your favor) or 1X ones stoploss, move the stoploss to 3pips in front of the order to protect from having any loss on the trade. This will ensure you have atleast a 3 pip profit if there is a sudden change in market conditions.
For example, say the swing low/high was 15 pips which is your stoploss on an order. In this instance the price action moves 16 pips and not the fixed 30 pips. Because the price action has moved the stoploss size you would again move your stoploss to +3 pips versus waiting for a 30 pips move because your order has already reached the 50% level of the life of that order and ones objektive is always to protect the overall account balance.
Yes, in whipsaw action one may get stopped out more often but in those cases it usually means the market is not ready to move in the direction of your order and you can wait on new pricing action that normally means a second entry order is soon to come at a better price than the first because the market was simply not ready.
Part 4: Indikators - Order Entry
SAFT is a very basic system setup on the premise of price action trend, divergence, and momentum. SAFT uses only one basic indikator, the traders ability to draw trendlines, and another addon indikator as a signal to tell one it is time to draw trendlines and begin looking for price action directional change.
The indikator the SAFT Strategy uses is the most basic of indikators and is included in the standard Metatrader. The indikator is the On Balance Volume indikator.
On Balance Volume (OBV) measures buying and selling pressure as a cumulative indicator that adds volume on up days and subtracts volume on down days. OBV was developed by Joe Granville and introduced in his 1963 book, Granville's New Key to Stock Market Profits. It was one of the first indicators to measure positive and negative volume flow. Chartists can look for divergences between OBV and price to predict price movements or use OBV to confirm price trends.
Calculation
The On Balance Volume (OBV) line is simply a running total of positive and negative volume. A period's volume is positive when the close is above the prior close. A period's volume is negative when the close is below the prior close.
If the closing price is above the prior close price then:
Current OBV = Previous OBV + Current Volume
If the closing price is below the prior close price then:
Current OBV = Previous OBV - Current Volume
If the closing prices equals the prior close price then:
Current OBV = Previous OBV (no change)
This indikator determines the price action momentum of a price action movement. One know can see the strength of whether the BULLS or the BEARS control the markt price action.
Basic Order entry criterea:
One can draw then draw the proper trendline connecting the tops in a downtrend or bottoms in an uptrend on both the price action and OBV indikators. Once the trendlines in both parts are broken that is the point an entry order is made. (see screenshot)
Additionally, the stoploss will be assigned at the last swing low/high of the price action. The target take profit level is 2X the size of the stoploss initially set. (see screenshot)
-----------------------------------------------------------------------------------------------------------------------------------------------------
(EDIT July 2012 addon indikator)
Addon indikator; in addition divergence in price action is a key sign that price action is in the process of directional change. Therefore an add on indikator I have found to be useful is the FX5 MACD Divergence indikator. This indikator will begin to draw divergence lines as criterea is met by the indikator that show possible divergence. However, I only use this indikator as an early warning that it is time for one to begin looking at the charts to draw ones own trendlines and begin looking for entry points. Also, sometimes the trendline direction for a trade that I am looking to place an order may be opposite what the indikator shows. In any case I have found this indikator is an excellent early warning tool to alert one on when one should begin looking at the charts to construct trendlines and looking for breaks as price action and momentum change direction. (attachment in post #1)
(EDIT 15 Aug 2012 possible addon indikator)
To addon to the discussions on a good indikator to help in drawing trendlines one could use one of the following..zigzag, semafor, fractals, or high/low. However, I have been testing and a indikator that I do like to help with trendlines is a indikator called DeMark Trendline Trader. I think it does a fairly good job but the disadvantage is that it immediatly removes the past lines when it draws new one. I like having a few of the past lines in drawing trendlines so for my manual is my preferred. However, this indikator does a good job and provides one both a upside and downside trendline to choose from. For my OBV is always going to be the decider on markt direktion.
(see attachments in post #1 for this indikator)
(EDIT 19 Aug 2012 SAFT using MA lines versus drawing trendlines)
It has been discussed and discovered that using MA line crosses applied to price action and the OBV indikator does a very close representation to drawing the trendlines manually and then looking for the breaks to trigger an order. I have therfore attached to this post the ''strengthanalysisforextrading template.tpl'' that does a great job at obtaining the same conclusions as using manual drawn trendlines and look for crosses. HOWEVER, due to lack of liquidity during the asian sessions I recommend NOT using this during asian markt times.
-----------------------------------------------------------------------------------------------------------------------------------------------------
Part 5: Money Managment, and Exit Strategy
Proper Money Management skills are essential to becoming a successful trader. Money Management is by far the most important skill to master. Money management is simply a management skill incorporate that will effectively preserve capital while you increase your profits. In other words a good system will help keep you from losing all of your money and help you make money.
One of the most difficult tasks a trader has is when to take profit. Knowing when and where to take ones profit can make all the difference because know when to take that profit can turn a very profitable order in to a no profit or lossing order. Therefore it is very important to know WHEN TO EXIT A TRADE. Here are three exit strategies that I use with SAFT to determine which level of risk one is willing to tolerate while at the same time increasing ones account balance to meet the goals of the growth schedule.
Exit Strategy 1 (most conservative)
Once an order has been initiated and the target of 2X stoploss has been identified one sets a take profit in the MetaTrader and takes the full profit of the order as the target level is reached.
Exit Strategy 2 (moderate balance)
Once an order has been initiated and the target 2X stoploss has been identifies one watches the order and removes 1/2 of the order size as the target ''take profit'' level is reached. The remaining 2/2 of the order remains and a trailing stoploss is assigned to the order that is the same size as the original stoploss of the order. The the order is allowed to run until the price action reaches a level where one has a counter signal or the stoploss is hit.
Exit Strategy 3 (most agresssive)
Once an order has been initiated and the target 2X stoploss has been identified and reached; a trailing stoploss is assigned to the order that is the same size as the original stoploss of the order. The the order is allowed to run until the price action reaches a level where one has a counter signal or the stoploss is hit.
SAFT System Usage:
The SAFT System can be used in any currency pair, commodity, futures, or stocks trading markts. The SAFT System can be used in virtually any timeframe however, I have found that timeframes lower than 15 mins are prone to more unpredictable moves as the lower timeframes are more prone to exaggerated moves with in a larger timeframe and the larger timeframes tend to have more stable an predictable price action movements.
CONCLUSION:
It is my belief that if one uses the SAFT System with consistancy and discipline one can easily begin to grow ones account in a consistant manner. The level of success will vary based on ones risk tolerence and skill level but one should be able to profit overall if all the parts of the SAFT System are utilized equally.
Evaluator.:nerd:
Attached Image(s) (click to enlarge)
Attached File(s)