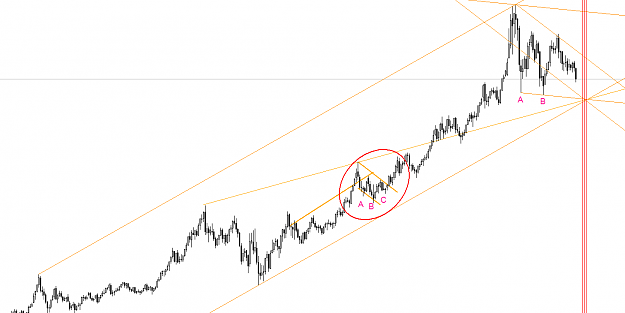
1) Gold (XAU/USD) 4 Hours Chart (Weekly View) – 19.01.2012
Gold price has entered into a Bullish Sentiment on the 4 Hours chart, where We can clearly see a “Red Cross” Fromation (50 SMA has Crossed with the 200 SMA). This could be a trend reversal if the Bullish Signal will be confrimed by the Break of the Main Downtrendline on the Higher Time Frames.
Another Conflictual signal is the Bearish volume on the 4 Hour chart. this means we shoul be careful for a False Break-out of the 200 SMA if the downtrend Line Holds as resistence.
Bullish Probability could break the Main Downtrend Line around 1675 Resistence and reach 1691,18(Weekly R2 Pivot confluence with 38.2 Fibonacci retracement), retrace back to 1662,72(weekly R1 Pivot, confluence with downtrend Line and 50 Fibonacci Retracement), before resuming Upside to 1710,12(Monthly R1 Pivot) and 1720,12(WeeklyR3 Pivot close to 23,6 Fibonacci resistence). This could be a great Level for the Price to retrace Bearish.
Bearish Probability could find resistence at the Main Downtrend Line and Break 1662,72(confluence between Weekly R1 Pivot and 50 Fibonacci), and fall further to 1633,78 (Weekly Main Pivot, confluence with the 200SMA), breaking the Uptrend Line on 4 Hours Chart. This is a strong Key-Level to hold as support until the next support around 1616,48 (Monthly Main Pivot confluence with 100SMA on 4 Hours chart.) Between this 2 Main Key-Levels price could Move side-ways for a Few Days before resuming the Uptrend.
http://freeleaders.files.wordpress.c...pg?w=500&h=278
http://freeleaders.files.wordpress.c...pg?w=500&h=272
2) SILVER (XAG/USD) 4 Hours Chart (Weekly View) – 19.01.2012
Silver Price has Broken the 200 Simple Moving Average on 4 Hours Chart and has formed a “Red Cross” (50 SMA cross with 200 SMA) simillar to Gold. This could signal a Trend Reversal. The Sentiment is Bullish with Bullish Volume.
Silver Looks more Bullish than gold at this Moment.
Bullish Probability – If it Breaks 30,83(Weekly R1 Pivot confluence with the Downtrend Line) and confirms the Bullish Signal it could reach 31,84(weekly R2 Pivot), 32,22(Monthly R1 Pivot) and 32,97(Weekly r3 Pivot). Price is moving inside an uptrend Channel on 4 hours Chart and this would be a good level for a bearish retracement to the Channel Support.
Bearish Probability – If the 30,83(confluence between Dontrend Line and Weekly R1) holds as Resistence price could break the Uptrend Channel Support Line and reach 29,7(Weekly Main Pivot Line confluence with 200SMA). Price could Fall even further to 29,19(confluence between Monthly Main Pivot Line and 100 SMA on 4 Hours Chart). This is a Strong support and Key-Level for the Uptrend Continuation.
http://freeleaders.files.wordpress.c...pg?w=500&h=276
http://freeleaders.files.wordpress.c...pg?w=500&h=278
To Your Success,
Doctortyby (Tiberiu)