Hi fellow members of FF,
in this thread on the Art to Draw Correct Trendlines I would like to keep track of market movements as they unfold in building new highs and lows.
Those swingspoints might become a certain meaning after some time.
The art of connecting these swingpoints is very simple but at the same time also very powerful.
It helps to understand the movements better and also helps to make solid decisions for to go long or short.
The charts I will post here will be in the timeframes from 1 month down to 30min.
Fellow members are invited to contribute their own charts of all markets and with all other indicators they like, unless they show also trendlines on their charts.
This thread is not about trading and calls for imminent price action are not given.
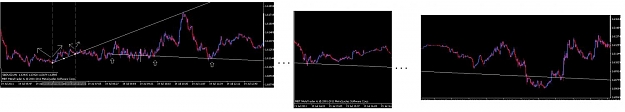
The first chart is a 1MN eu
in this thread on the Art to Draw Correct Trendlines I would like to keep track of market movements as they unfold in building new highs and lows.
Those swingspoints might become a certain meaning after some time.
The art of connecting these swingpoints is very simple but at the same time also very powerful.
It helps to understand the movements better and also helps to make solid decisions for to go long or short.
The charts I will post here will be in the timeframes from 1 month down to 30min.
Fellow members are invited to contribute their own charts of all markets and with all other indicators they like, unless they show also trendlines on their charts.
This thread is not about trading and calls for imminent price action are not given.
The first chart is a 1MN eu
Attached Image (click to enlarge)
/ ... clarifying decisions ... /