Financial Markets Observatory Lab.
H! ALL [bad English, sorry ]
]
MACRO-ECONOMIC LAB.: Employment data
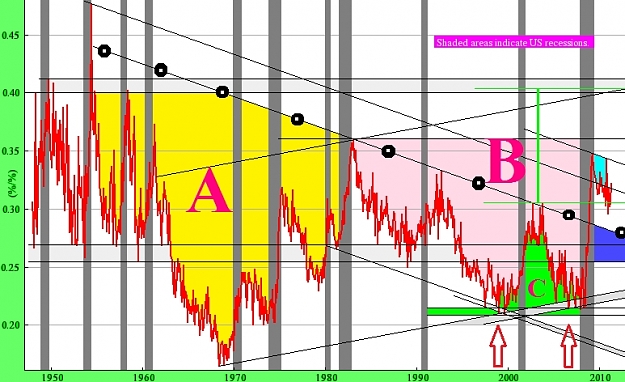
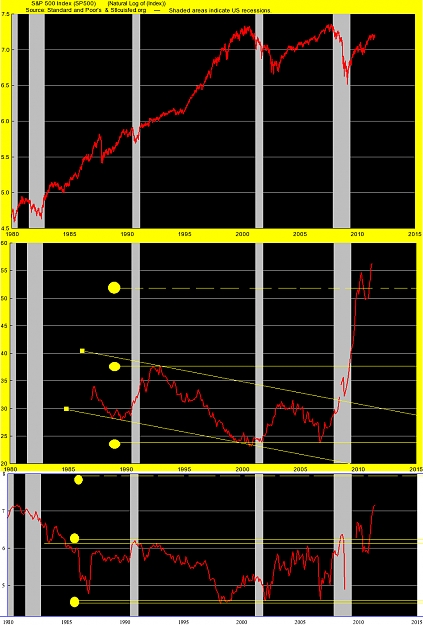
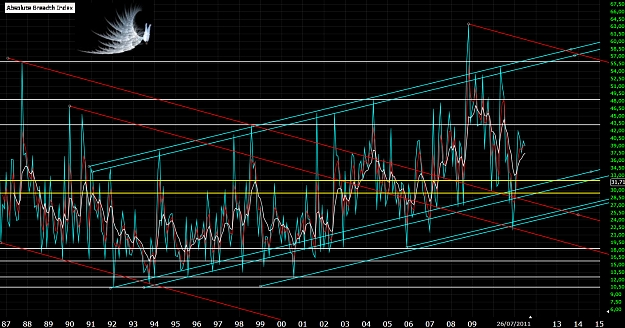
In the chart there is the r-spread between two unemployment rates: civilian 25 years and over vs. civilian 16 to 19 years.
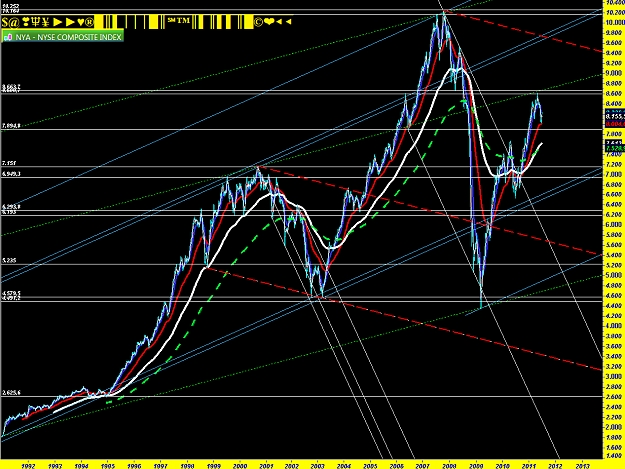
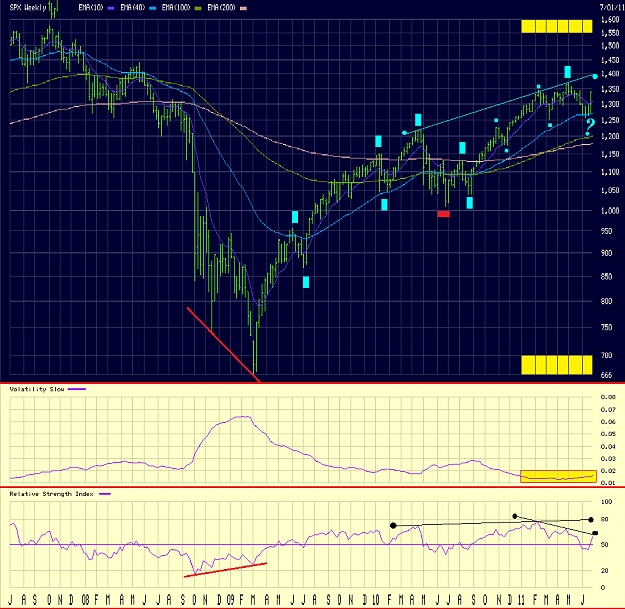
Equity benchmarks for comparations (ema-format charts: prices replaced by exp.mov.aver.) are as follows:
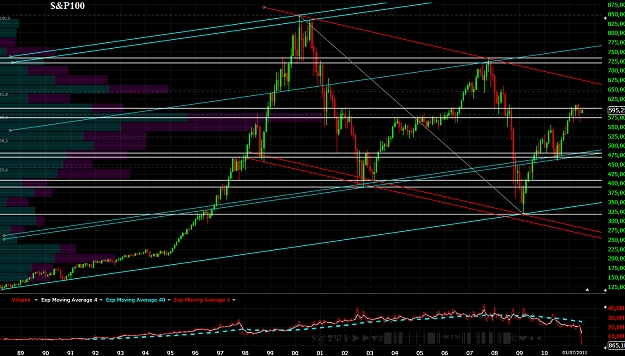
♚ IOO (chart; data) for global equity;
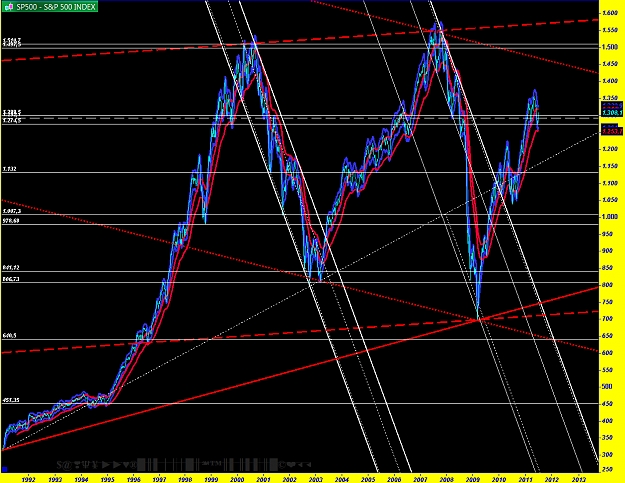
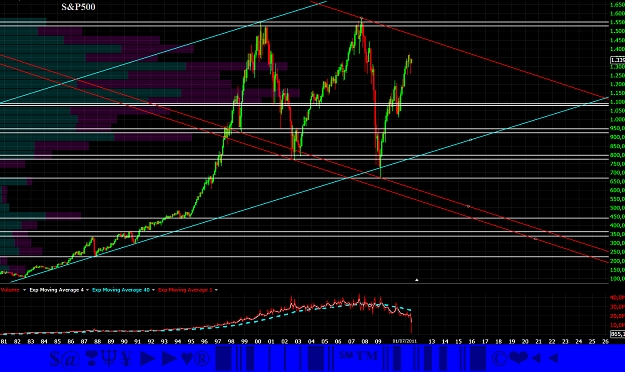
♛ S&P1500 (chart; data) (for US equity).
This curve shows contrarian array vs. equity benchmarks, bacause the civilian segment more important (as GDP factor) is the first of ratio (r-spread).
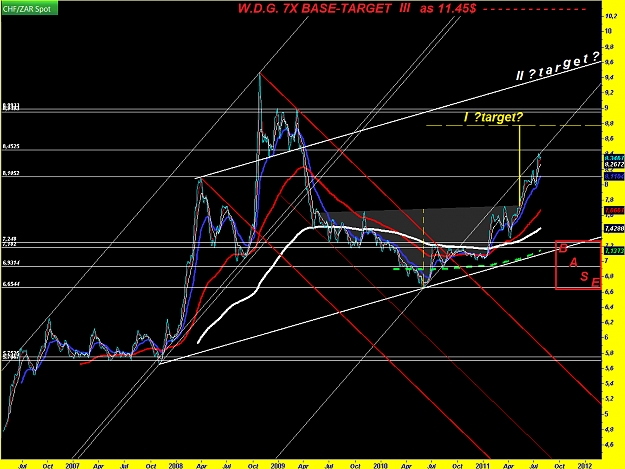
The graphical patterns of this curve are as follows:
➊ curve-array has ascending pattern from '70 (in negative divergence vs. equity benchmarks);
➋ recent curve-array shows an important local (negative) divergence 2000/2007 (ascending lows) vs. equity benchmark tops (ascending);
➌ from '70, we can see an ascending rectangle in progress;
➍ from chart origin, we can se a bullish-break of main descending lines, with a preliminary start of a new long term bullish leg !!!
➎ the green area (Ⓒ-area) is a double-lows (2000/2007 about), validated in bullish status and with graphical target marked with green column (0.40/0.41 spread pt. critical level !!!);
➏ a second area (pink: Ⓑ-area) is in progress and shows a possible graphical target (only with curve above 0.36 spread pt.) of +0.16 pt. (a real negative mini-monster for equity benchmarks ???);
➐ megalithic yellow-area (Ⓐ) is theoretically-only, but Ⓑ-area linked !!!
The bearish real pivot of curve is the blue-area below to actual curve-level; if spread go below this area, the curve re-obtain an important bearish-array (positive for stocks-markets).
The bullish real pivot of curve is the turquoise-area above to actual curve-level; if spread go above this area, the curve re-start in the bullish-array, Ⓑ-area go in a validation status (negative for stocks-markets), Ⓒ-area complete the figure, and start a possible monster bull-leg of curve (very negative for stocks-markets).
Alert on macro-economy data.
☻/
/▌
/|
Tuned on main trend, and follows short-medium term signs from underlying prices, for a real-time and correct set-up.
It is very important do not anticipate the main trend of the underlying financial instruments.
K€SADDhAPHA'pe'KAMPA' €MP¥R€ $0UND $¥$T€M$ ❣❣❣
I.M.O. by $@❣♆¥ ❤ █║▌│█│║▌║▌║| █
  ❤
❤
http://profile.ak.fbcdn.net/hprofile..._2727979_n.jpg
H! ALL [bad English, sorry
MACRO-ECONOMIC LAB.: Employment data
In the chart there is the r-spread between two unemployment rates: civilian 25 years and over vs. civilian 16 to 19 years.
Equity benchmarks for comparations (ema-format charts: prices replaced by exp.mov.aver.) are as follows:
♚ IOO (chart; data) for global equity;
♛ S&P1500 (chart; data) (for US equity).
This curve shows contrarian array vs. equity benchmarks, bacause the civilian segment more important (as GDP factor) is the first of ratio (r-spread).
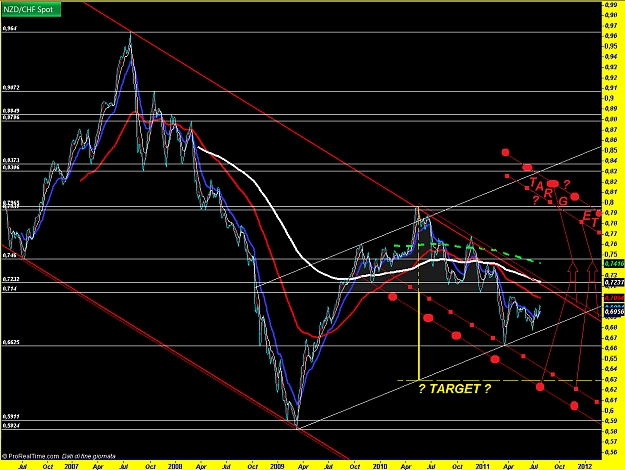
The graphical patterns of this curve are as follows:
➊ curve-array has ascending pattern from '70 (in negative divergence vs. equity benchmarks);
➋ recent curve-array shows an important local (negative) divergence 2000/2007 (ascending lows) vs. equity benchmark tops (ascending);
➌ from '70, we can see an ascending rectangle in progress;
➍ from chart origin, we can se a bullish-break of main descending lines, with a preliminary start of a new long term bullish leg !!!
➎ the green area (Ⓒ-area) is a double-lows (2000/2007 about), validated in bullish status and with graphical target marked with green column (0.40/0.41 spread pt. critical level !!!);
➏ a second area (pink: Ⓑ-area) is in progress and shows a possible graphical target (only with curve above 0.36 spread pt.) of +0.16 pt. (a real negative mini-monster for equity benchmarks ???);
➐ megalithic yellow-area (Ⓐ) is theoretically-only, but Ⓑ-area linked !!!
The bearish real pivot of curve is the blue-area below to actual curve-level; if spread go below this area, the curve re-obtain an important bearish-array (positive for stocks-markets).
The bullish real pivot of curve is the turquoise-area above to actual curve-level; if spread go above this area, the curve re-start in the bullish-array, Ⓑ-area go in a validation status (negative for stocks-markets), Ⓒ-area complete the figure, and start a possible monster bull-leg of curve (very negative for stocks-markets).
Alert on macro-economy data.
☻/
/▌
/|
Tuned on main trend, and follows short-medium term signs from underlying prices, for a real-time and correct set-up.
It is very important do not anticipate the main trend of the underlying financial instruments.
K€SADDhAPHA'pe'KAMPA' €MP¥R€ $0UND $¥$T€M$ ❣❣❣
I.M.O. by $@❣♆¥ ❤
http://profile.ak.fbcdn.net/hprofile..._2727979_n.jpg
Attached Image (click to enlarge)