VSA/Wyckoff/Supply,Demand.
UPDATED:
I've seen that many traders trying to apply VSA are having a hard time. The available books and software leave them confused, but knowing there is obviously great value in it.
Here I'll be sharing my methods, which take a more simple approach. Feel free to post your questions, contributions and comments.
--------------------
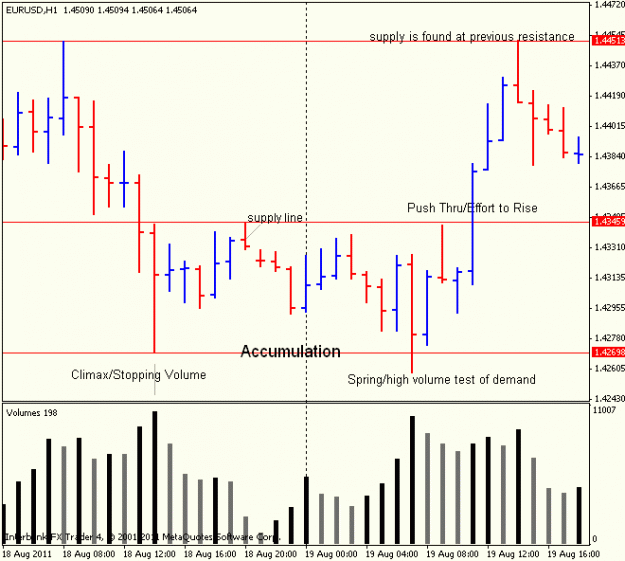
Accumulation
Accumulation begins with stopping (ultra high) volume on a down move, then into a range. Professional money is buying. They do not just go into the market and start massive buying however. This will only put the price up against them, so they accumulate over a period of time, buying when bouts of selling come into the market to get the lowest prices. Higher volume is seen at lower prices. Once this phase has been established we also refer to it as "strength in the background".
Distribution
Distribution begins with stopping/climactic (ultra high) volume on an up move, then into a range. Professional money is selling (the reverse of accumulation). As the market rallied, a level was reached at which traders who have missed out on the up move or have sold prematurely are liable to buy late in the up move. This gives professionals the opportunity to sell unnoticed in terms of price, but the volume will be very high at the higher prices. This phase is also referred to as "weakness in the background".
Test (low Volume)
Testing is a very frequent signal. Look to buy when you already have signs of strength in the background (stopping volume/accumulation), pushed through a small area of supply, and came back to test that supply on low volume. It should be followed by an immediate up move. This is my most common trade entry.
Test (high Volume)
Demand is still present on a high volume test of support (low prices). With strength in the background, this is similar to stopping volume showing the activity of professional traders still taking long positions for an expected up move, at lower prices. Supply would be shown if this test is at a recent supply level.
Effort to Rise/Push Thru
Price pushes through an area of resistance (supply) without a significant volume increase. This shows that sellers are no longer interested in that level, and price will continue up until more supply is found.
Effort to Rise (Failed)
There is a wider spread up bar on high volume while the next bar reverses down. It's a serious sign of weakness.
If the next bar(s) are down, this can only show that, within the high volume seen bar before, selling overcame the demand.
Upthrust
Upthrusts are money-making traps to catch stops and are usually signs of weakness. If you have a distribution area directly behind you, it now becomes a very strong indication of weakness. And, if the volume is high, it adds more weight. A sharp move down to follow will confirm the weakness.
Why have upthrusts? In any market, you will have stop orders above the market. Because traders think the same things collectively, these stops will be in a fairly close price band. Then, the market makers, knowing where these stops are, hit them with little cost to themselves.
The same applies in reverse in down markets and we call it a "spring".
Buying/Selling Climax
On a buying climax there is a rapid price rise on high volume followed by bar(s) that do not make a higher close. Uniformed traders will continue to buy the trend, unknowingly. This gives the professional trader the opportunity to sell into the buying at very high prices without bringing the market down yet. This stops the bull market.
Shake Out
(Before an expected up move) This is a widespread down bar that then reverses to close near the open or highs on high volume. This is a money-making maneuver to hit stops. Traders who were thinking bullish are now fearful to enter the market. This shows that professional money is coming in and buying, absorbing the weak sellers.
All of these apply in reverse as well.
This first post is a work in progress, stay tuned. Here's a chart showing a few of these terms.
UPDATED:
I've seen that many traders trying to apply VSA are having a hard time. The available books and software leave them confused, but knowing there is obviously great value in it.
Here I'll be sharing my methods, which take a more simple approach. Feel free to post your questions, contributions and comments.
--------------------
Accumulation
Accumulation begins with stopping (ultra high) volume on a down move, then into a range. Professional money is buying. They do not just go into the market and start massive buying however. This will only put the price up against them, so they accumulate over a period of time, buying when bouts of selling come into the market to get the lowest prices. Higher volume is seen at lower prices. Once this phase has been established we also refer to it as "strength in the background".
Distribution
Distribution begins with stopping/climactic (ultra high) volume on an up move, then into a range. Professional money is selling (the reverse of accumulation). As the market rallied, a level was reached at which traders who have missed out on the up move or have sold prematurely are liable to buy late in the up move. This gives professionals the opportunity to sell unnoticed in terms of price, but the volume will be very high at the higher prices. This phase is also referred to as "weakness in the background".
Test (low Volume)
Testing is a very frequent signal. Look to buy when you already have signs of strength in the background (stopping volume/accumulation), pushed through a small area of supply, and came back to test that supply on low volume. It should be followed by an immediate up move. This is my most common trade entry.
Test (high Volume)
Demand is still present on a high volume test of support (low prices). With strength in the background, this is similar to stopping volume showing the activity of professional traders still taking long positions for an expected up move, at lower prices. Supply would be shown if this test is at a recent supply level.
Effort to Rise/Push Thru
Price pushes through an area of resistance (supply) without a significant volume increase. This shows that sellers are no longer interested in that level, and price will continue up until more supply is found.
Effort to Rise (Failed)
There is a wider spread up bar on high volume while the next bar reverses down. It's a serious sign of weakness.
If the next bar(s) are down, this can only show that, within the high volume seen bar before, selling overcame the demand.
Upthrust
Upthrusts are money-making traps to catch stops and are usually signs of weakness. If you have a distribution area directly behind you, it now becomes a very strong indication of weakness. And, if the volume is high, it adds more weight. A sharp move down to follow will confirm the weakness.
Why have upthrusts? In any market, you will have stop orders above the market. Because traders think the same things collectively, these stops will be in a fairly close price band. Then, the market makers, knowing where these stops are, hit them with little cost to themselves.
The same applies in reverse in down markets and we call it a "spring".
Buying/Selling Climax
On a buying climax there is a rapid price rise on high volume followed by bar(s) that do not make a higher close. Uniformed traders will continue to buy the trend, unknowingly. This gives the professional trader the opportunity to sell into the buying at very high prices without bringing the market down yet. This stops the bull market.
Shake Out
(Before an expected up move) This is a widespread down bar that then reverses to close near the open or highs on high volume. This is a money-making maneuver to hit stops. Traders who were thinking bullish are now fearful to enter the market. This shows that professional money is coming in and buying, absorbing the weak sellers.
All of these apply in reverse as well.
This first post is a work in progress, stay tuned. Here's a chart showing a few of these terms.
Attached Image (click to enlarge)