I recently saw a BBC Planet Earth documentary where they compared the humans failure of understanding the laws of the universe with a dog's failure of understanding simple physics. In this problem I am about to present to you I feel like the dog in the example. 
I have been creating EA´s for Metatrader for more than a year now with limited success as far as any results goes. Because of the failures to produce a continious positive equity-curve over any longer period of time whatsoever and the relative ease to produce a negative equity-curve I set myself a new goal.
That goal was to create a higher timeframe-based system continious negative equity-curve and then inverting the trades in all aspects.
I have now reached that goal and I can´t say that I really thought it would work but I also wouldn´t have expected theese confusing results.
What are the reasons for both curves being negative?
We can´t blame it all on the spreads because it is based on hourly timeframes, and although it surely may have some effect it just can´t be the whole explanation.
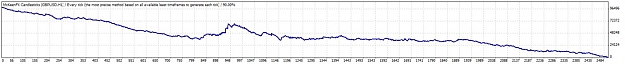
First attachment below is the original trades curve over a 2,5 year period (starting Jan 2008 - today).
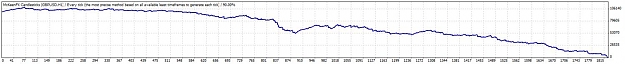
Second attachment is the inverted curve over the same period of time.
My question to anyone is, what are the reasons that inverting trades also seem absolutely impossible, even on higher timeframes, wide tp´s & sl´s and over extended periods of time? Stops and TP´s average around 50-500 pips so once again, spreads just can´t be the whole reason for this. Or could it? What is it that I fail to see and understand?
Thanks so much in advance to anyone who might shed some light to a dog trying to understand the laws of financial instruments.
/ McKeen
I have been creating EA´s for Metatrader for more than a year now with limited success as far as any results goes. Because of the failures to produce a continious positive equity-curve over any longer period of time whatsoever and the relative ease to produce a negative equity-curve I set myself a new goal.
That goal was to create a higher timeframe-based system continious negative equity-curve and then inverting the trades in all aspects.
I have now reached that goal and I can´t say that I really thought it would work but I also wouldn´t have expected theese confusing results.
What are the reasons for both curves being negative?
We can´t blame it all on the spreads because it is based on hourly timeframes, and although it surely may have some effect it just can´t be the whole explanation.
First attachment below is the original trades curve over a 2,5 year period (starting Jan 2008 - today).
Second attachment is the inverted curve over the same period of time.
My question to anyone is, what are the reasons that inverting trades also seem absolutely impossible, even on higher timeframes, wide tp´s & sl´s and over extended periods of time? Stops and TP´s average around 50-500 pips so once again, spreads just can´t be the whole reason for this. Or could it? What is it that I fail to see and understand?
Thanks so much in advance to anyone who might shed some light to a dog trying to understand the laws of financial instruments.
/ McKeen
Attached Image(s) (click to enlarge)