5 Point Strategy for Trending markets
Indicators Used:
0. Time Frame -
----- 15 minute.
1. Moving Averages - (As in Template)
----- 4 period Linear Weighted Moving Average (LWMA)
----- 16 period Simple Moving Average (SMA)
----- 96 period Simple Moving Average (SMA)
2. Stochastic Oscillator - (As in Template)
----- %k and %d set to 42
----- slowing set to 12
3. Awesome Oscillator - (As in Template)
4. Relative Vigor Index - (As in Template)
----- 8 period.
5. Parabolic SAR - (As in Template)
Example:
Sell Entry:
Step 1: If 4LWMA and 16SMA are below 96SMA go to step 2. (Important)
Step 2: If 16SMA is above 4LWMA go to step 3.
Step 3: If Stochastic signal above main value go to step 4.
Step 4: If Parabolic SAR appears above candle/bar go to step 5.
Step 5: Place Sell entry and don`t forget a stop loss!
Sell Exit:
Step 1: If 16SMA is below 4LWMA - 1 point. (Important)
Step 2: If Parabolic SAR is below candle/bar - 1 point.
Step 3: If Stochastic signal below main value - 1 point.
Step 4: If RVI(Main and Signal) and AO are Positive - 1 point.
Step 5: If RVI(Main) is over RVI(Signal) and AO is Green - 1 point.
If 3 out of 5 points are satisfied close the trade.
Repeat the procedure in reverse for Buy Entry orders and Exits.
Suitable for short to medium term traders. Operational on 15 minute chart. But feel free to tweak and use your imagination!.
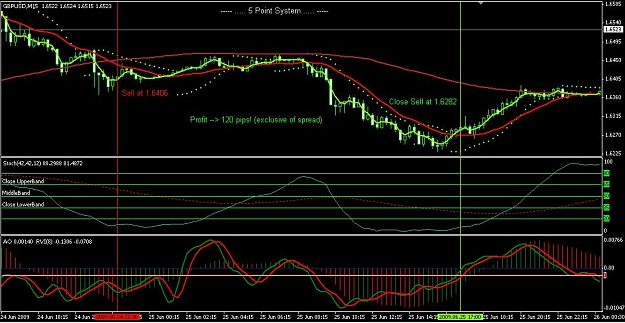
I have included an example image of good trade. (hypothetically)
Always try and use your own intuitive power as well!. Everyone is blessed.
I would be glad and appreciate feedback and comments.
Good Luck!.
god bless all,
zapper.
*All Trading Systems and Strategies carry risk. Please use this at your own risk and limit your exposure based on money management principles.