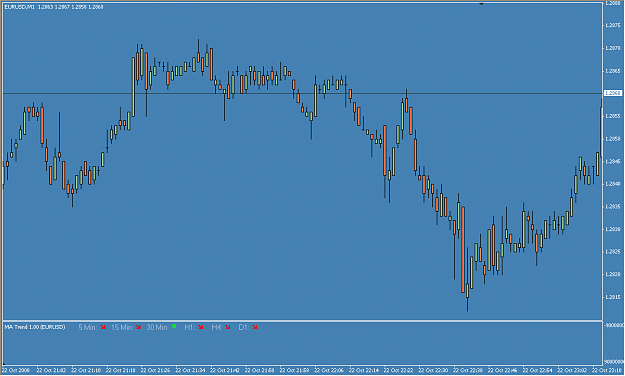
Hello. Is it possible to have something like a label to show through up or down arrows or so, what the other timeframes candles look like? I mean if I trade 1M is there anything I can use to see what's happening on the other timeframes like 5M, 15M 1H, 4H and Daily, without looking at other tabs? I'm not speaking about trends and MA to be used, just pure and simple candles: if they're up or down. I would be immensely grateful if someone could help me. Thank you in advance.