Hi everyone, this is my first post.... In my opinion this is such a wonderful site. I have been on here for a while just trying o absorb as much information as one can, now I feel as I should actually contribute something.
I have tried (demo'd) many systems and yet I find myself going back to one of the very first systems that I tried. Granted it has evolved over the time, but in my opinion its still a very simple and effective trading strategy.
I only use this one these pairs though in theory it should work on any pair.
3 Pairs-
GBP/JPY, GBP/USD, EUR/USD
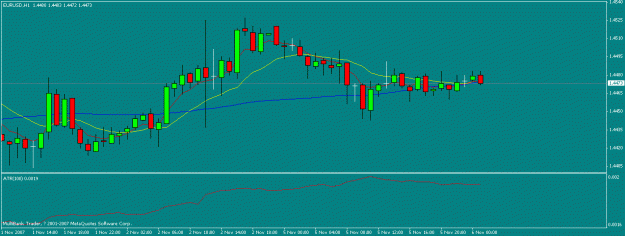
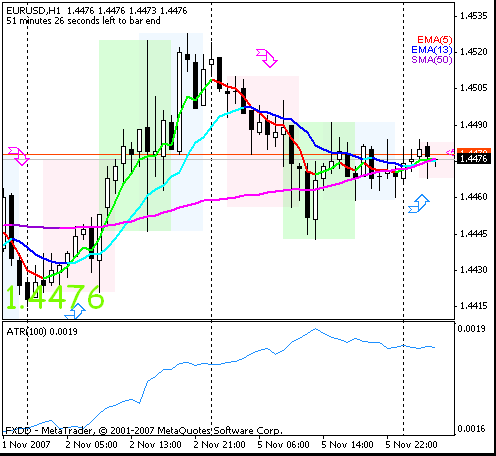
Indicators-
5 EMA set to close
13 EMA set to open
50 SMA set to close
ATR 100 period
Charts-
Daily - for trend confirmation
4H - for stop loss
1H- trades are placed on this TF
Stop Loss-
Value of the ATR on the 4H chart. Or when they EMA cross to the opposite direction.
Take Profit-
I let the trade run its course. Exit when I get the EMA's cross in the opposite direction or when I am happy with my profit. In other words I dont have a set TP level.
Entry's-
The basic entry of the position is on the 1H chart and it is when the 5 and 13 cross. Typically I will wait for the next candle to open following the cross to enter and or wait for price to retrace to the 5ema to enter to avoid getting in at a bad spot...
Before I enter I check the Daily chart to see wether the 5 is above or below the 50.
If the 5 is ABOVE the 50 on the Daily then I only trade "long positions" on the hourly(5 crossing 13 to the upside).
If the 5 is BELOW the 50 on the Daily then I only trade "short positions" on the hourly (5 crossing 13 to the downside).
As soon as i figure out how to post some charts I will add them.
For the people who cant trade the 1H becuase of work and family and all that. I have also had success trading on the 4H.
Same rules apply just replace 1H with 4H and use the Weekly instead of the Daily.
The goal is to get the idea of what the bigger trend is and enter on a smaller Time Frame
Thanks
BAM BAM
I have tried (demo'd) many systems and yet I find myself going back to one of the very first systems that I tried. Granted it has evolved over the time, but in my opinion its still a very simple and effective trading strategy.
I only use this one these pairs though in theory it should work on any pair.
3 Pairs-
GBP/JPY, GBP/USD, EUR/USD
Indicators-
5 EMA set to close
13 EMA set to open
50 SMA set to close
ATR 100 period
Charts-
Daily - for trend confirmation
4H - for stop loss
1H- trades are placed on this TF
Stop Loss-
Value of the ATR on the 4H chart. Or when they EMA cross to the opposite direction.
Take Profit-
I let the trade run its course. Exit when I get the EMA's cross in the opposite direction or when I am happy with my profit. In other words I dont have a set TP level.
Entry's-
The basic entry of the position is on the 1H chart and it is when the 5 and 13 cross. Typically I will wait for the next candle to open following the cross to enter and or wait for price to retrace to the 5ema to enter to avoid getting in at a bad spot...
Before I enter I check the Daily chart to see wether the 5 is above or below the 50.
If the 5 is ABOVE the 50 on the Daily then I only trade "long positions" on the hourly(5 crossing 13 to the upside).
If the 5 is BELOW the 50 on the Daily then I only trade "short positions" on the hourly (5 crossing 13 to the downside).
As soon as i figure out how to post some charts I will add them.
For the people who cant trade the 1H becuase of work and family and all that. I have also had success trading on the 4H.
Same rules apply just replace 1H with 4H and use the Weekly instead of the Daily.
The goal is to get the idea of what the bigger trend is and enter on a smaller Time Frame
Thanks
BAM BAM