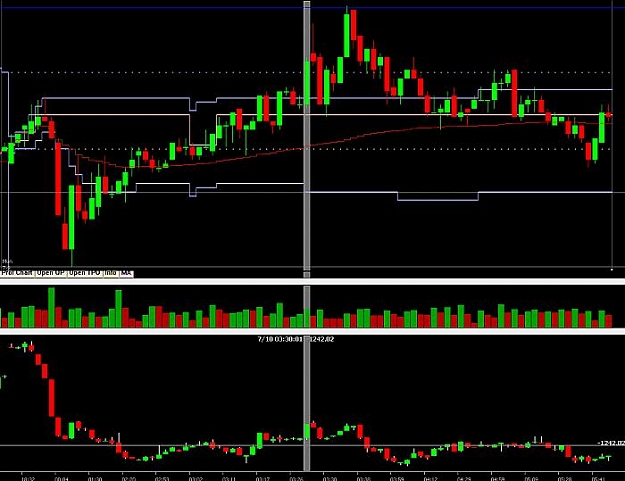
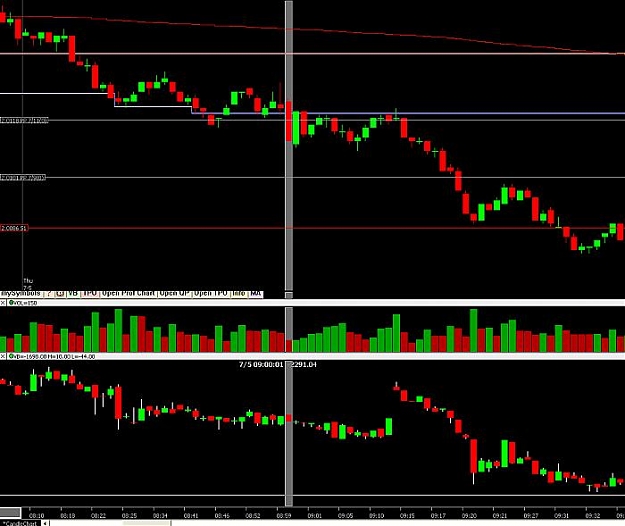
These are 50 tick bars on Invester/RT charts with DTN data which is the best of the best in all my experience. I am using GBP futures from CME/Globex to show volume and price. The red moving average is a VWAP (volume weighted average price). The VWAP is important because when price is above the VWAP it signals that the majority of traders short the market are losing money and the majority of buyers in the market are making money. The pink and blue lines are value areas established by time/price/volume. The solid lines are present day data, and the dotted lines are yesterday's data. If you've used market profile you can understand what value areas are. Investor/RT takes it one step farther with volume data.
In the first indicator's pane we see volume highlighted in green or red based on buyers or sellers controlling the compression.
In the second indicator's pane we see daily accumulated volume (Delta Bars) flowing in a moving average fashion highlighted in green or red to identify buyers hitting offers or sellers hitting bids. The wick measures the high of the buying or the low of the selling which would be the extremes of the compression.
3:30am GBPPPI Input m/m http://www.forexfactory.com/images/m...mpact_high.gif0.6%
1.0%1.4%http://www.forexfactory.com/images/m...us_revised.gif
3:30am GBPPPI Output m/m http://www.forexfactory.com/images/m...impact_low.gif0.2%
0.3%0.4%
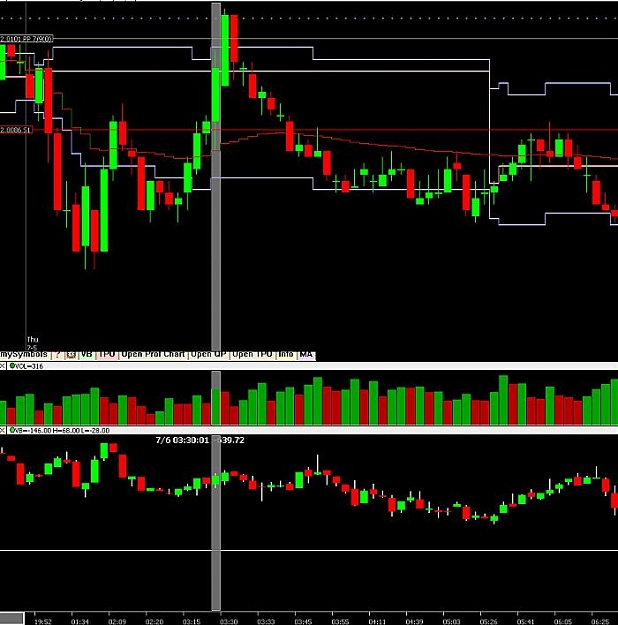
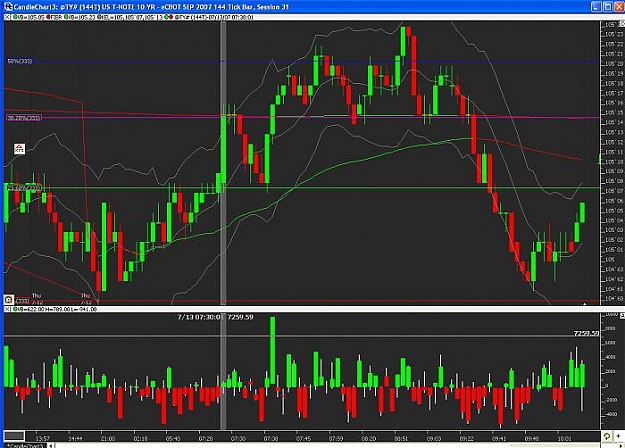
as we can see the hour leading into the news there are long orders hitting the gbp futures.
the news spike itself was dominated by long orders hitting the offer.
immediately after news we see traders flattening out and creating a thin market for prices to gap and allow traders to get in at better than market prices. during these times it is common to see price gapping up during sell volume as banks post sell orders at 2+ pips better than market. cumulatively after news the market went net short until 8am Central time (central is 1 hour earlier than EST and is standard time for futures contracts on CME)
In the first indicator's pane we see volume highlighted in green or red based on buyers or sellers controlling the compression.
In the second indicator's pane we see daily accumulated volume (Delta Bars) flowing in a moving average fashion highlighted in green or red to identify buyers hitting offers or sellers hitting bids. The wick measures the high of the buying or the low of the selling which would be the extremes of the compression.
3:30am GBPPPI Input m/m http://www.forexfactory.com/images/m...mpact_high.gif0.6%
1.0%1.4%http://www.forexfactory.com/images/m...us_revised.gif
3:30am GBPPPI Output m/m http://www.forexfactory.com/images/m...impact_low.gif0.2%
0.3%0.4%
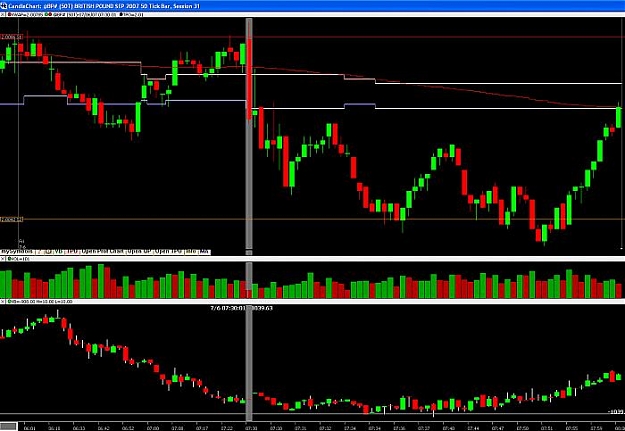
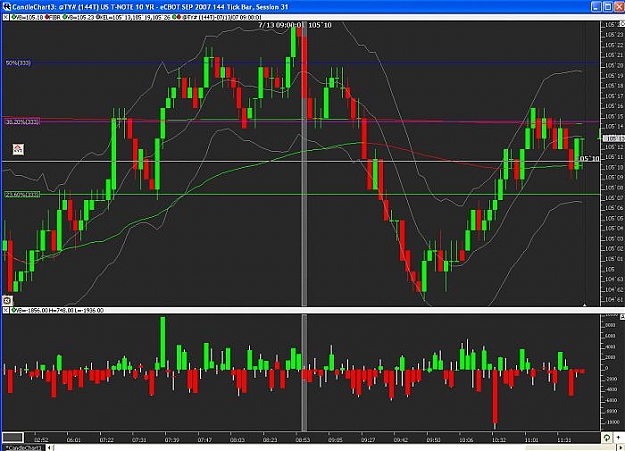
as we can see the hour leading into the news there are long orders hitting the gbp futures.
the news spike itself was dominated by long orders hitting the offer.
immediately after news we see traders flattening out and creating a thin market for prices to gap and allow traders to get in at better than market prices. during these times it is common to see price gapping up during sell volume as banks post sell orders at 2+ pips better than market. cumulatively after news the market went net short until 8am Central time (central is 1 hour earlier than EST and is standard time for futures contracts on CME)
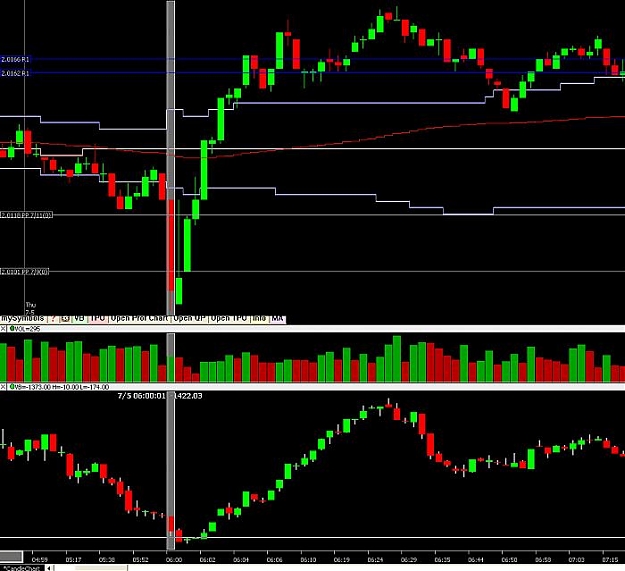
Attached Image (click to enlarge)
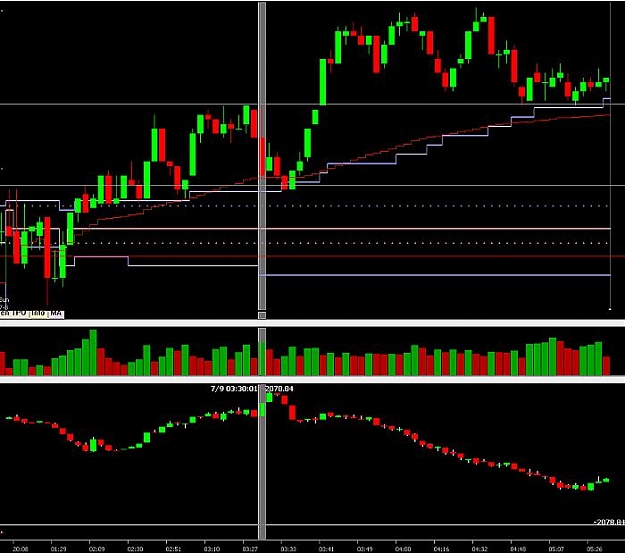
It really is that easy.