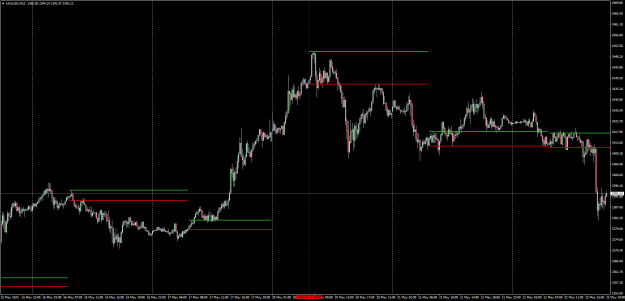
It's the mechanics of plotting a Japanese Candlestick Chart.
What the person in this video is explaining is just another story made up by someone's mind.
This, actually doesn't mean anything for the future price movements.
It's just telling a story about what the cnadles did in the past.
And yes, that's how candles work.
Only that we see this in the past - always!
PS. It's funny how people are making a big deal out of basic stuff!
And, it's frightening how many people think that this is some special, secret knowledge!
If you're looking for the Holy Grail indicator - STOP!
1