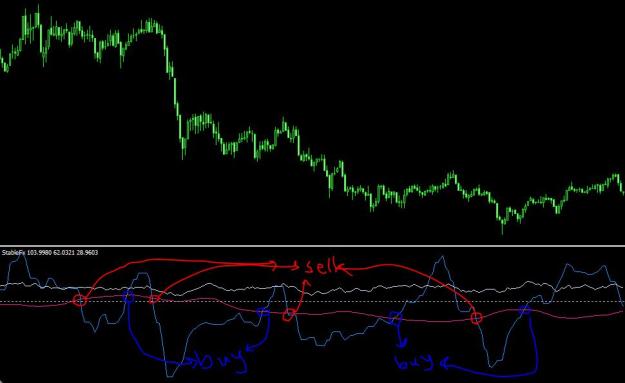
Disliked{quote} Im a bit confused. How can a candle close both above and below the middle trend? And which one of these lines are the middle trend? My chart looks like this when I add the indicator: {image}Ignored
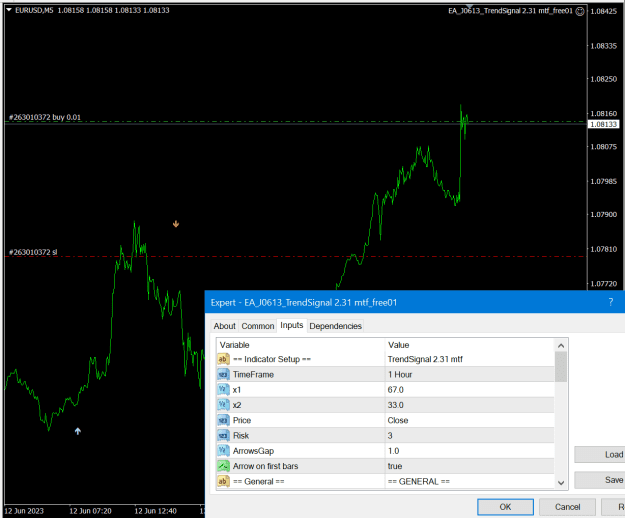
Sorry for any confusion in my request; thank you for replying. and i what i mean is: the first candle that closes below the middle line i would like for there to be candle markers that mark the high and low of that candle and vice versa the first candle that closes above the middle line the candle is marked by a small horizontal lines representing both the high and low of the candle.
The middle line is beneath the upper line and above the lower line..
Kind regards, Jon