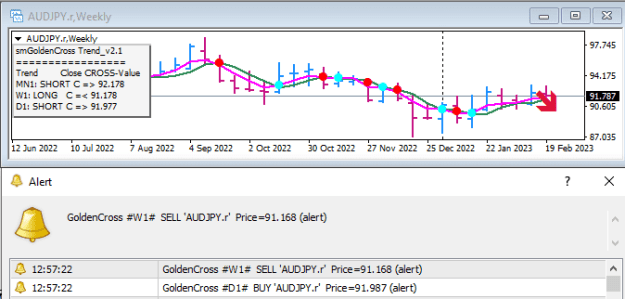
In the literature one finds different variants for the Golden-Cross and Death-Cross, mostly as a crossing of a short with a long moving average.
Here I present my own variant, namely the crossing of two LWMAs (Linear Weighted MA) calculated with period 5 for Open and Close.
The "smGoldenCross Trend" indicator plots the moving averages, or just the mean of the two moving averages.
An interesting and useful idea is to determine the future close values for which the crossing will take place.
A buy stop or sell stop on this level can be considered.
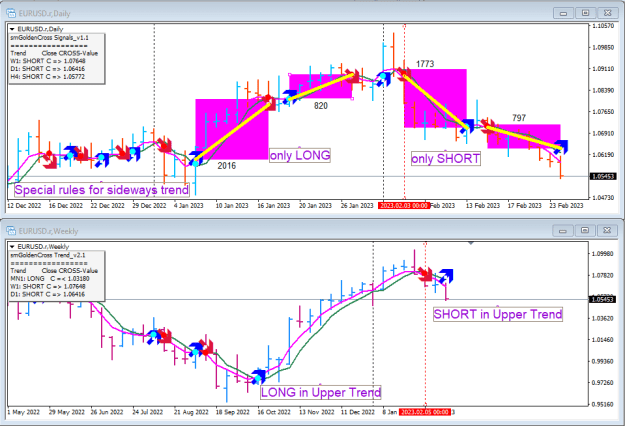
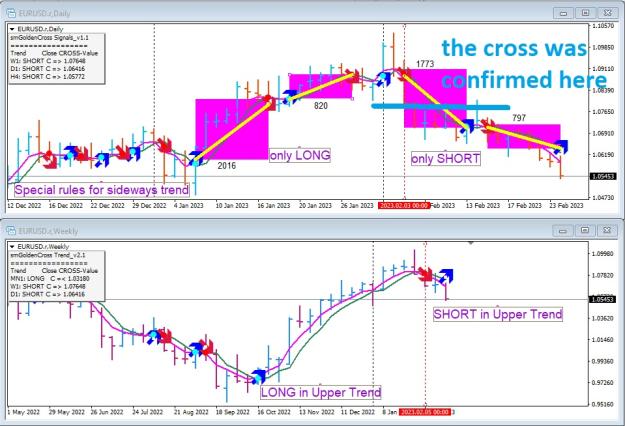
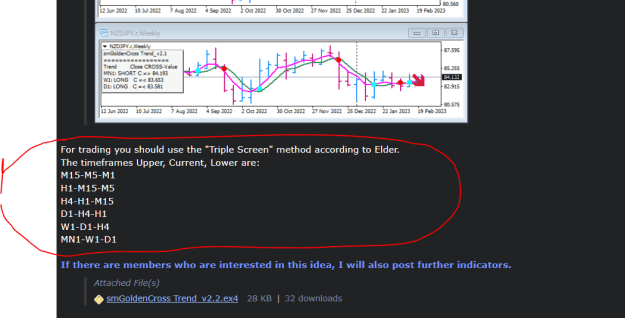
For trading you should use the "Triple Screen" method according to Elder.
The timeframes Upper, Current, Lower are:
M15-M5-M1
H1-M15-M5
H4-H1-M15
D1-H4-H1
W1-D1-H4
MN1-W1-D1
If there are members who are interested in this idea, I will also post further indicators.
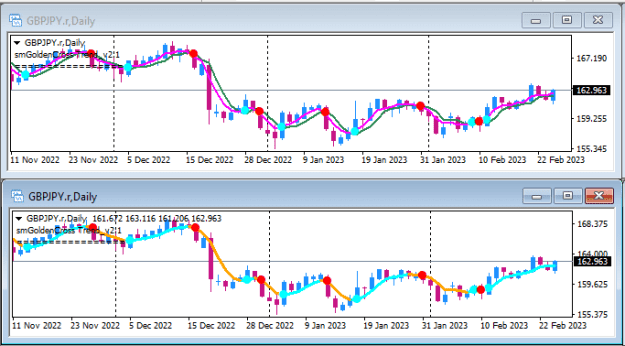
Here I present my own variant, namely the crossing of two LWMAs (Linear Weighted MA) calculated with period 5 for Open and Close.
The "smGoldenCross Trend" indicator plots the moving averages, or just the mean of the two moving averages.
Attached Image (click to enlarge)
An interesting and useful idea is to determine the future close values for which the crossing will take place.
A buy stop or sell stop on this level can be considered.
Attached Image (click to enlarge)
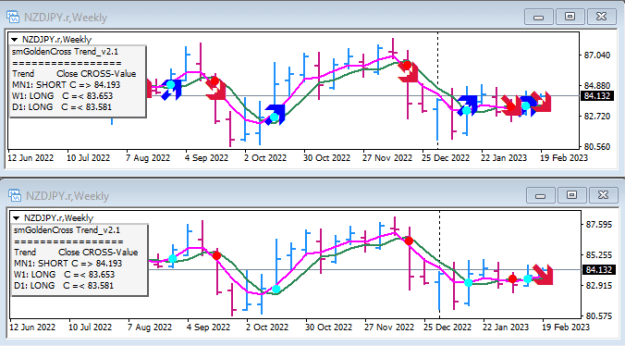
For trading you should use the "Triple Screen" method according to Elder.
The timeframes Upper, Current, Lower are:
M15-M5-M1
H1-M15-M5
H4-H1-M15
D1-H4-H1
W1-D1-H4
MN1-W1-D1
If there are members who are interested in this idea, I will also post further indicators.
Attached File(s)