The Missing Link?
I know I have posted what some would consider to be pretty wierd s#it before but even I will admit that this one is out there.
Even after Trading for so long I still feel that there is another factor to this that I, as yet, have not been able to unravel to my satisfaction.
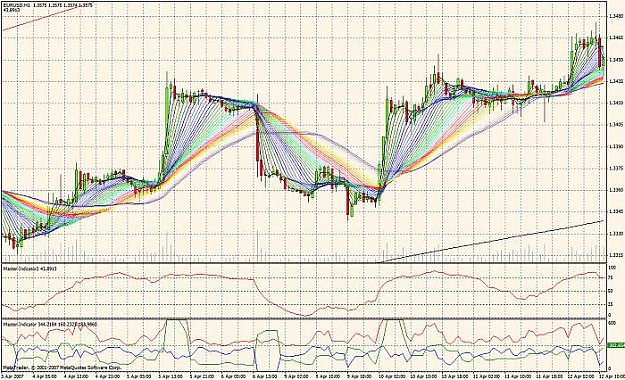
Why, when I am working in a 3 Dimensional World, am I only looking at 2 of them? {Chart}
Where/What is the Third Dimension?
Volume? Not functional in Retail FX.
Open Interest? I would dearly love to have a datastream on that.
First Notice? Insert your own Lengthy explanation here.
Last Trading Day? This is one I can't believe {place tongue firmly in cheek} that borkers don't routinely provide. Even just for the Current/Spot would be sufficient.
{Hey Merlin, that would be a swee...eet addition to the Calendar}
I have worked on this concept numerous times in the past but always end up throwing it back in the drawer till the next time.
What IF:
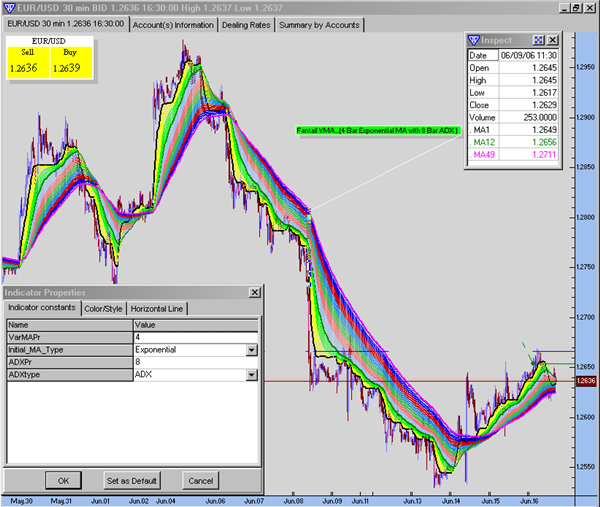
the chart you are looking at is not actually like a piece of string laid on a pleasingly coloured background but is in fact a Coil {like a spring} sitting on top of said pleasingly coloured background.
{I'm hoping Thom is into this and perhaps can generate some graphics to help explaine}
"I hate Flat Markets !"
What if we look at the Market as not being Flat but is in actuality travelling in the 3rd Dimension?
Either straight toward you or directly away from you.
Would that help in deciding an upcoming move?
Weekend ramblings of sitting in the Home Office cause it's raining and I can't mow the lawn
I know I have posted what some would consider to be pretty wierd s#it before but even I will admit that this one is out there.
Even after Trading for so long I still feel that there is another factor to this that I, as yet, have not been able to unravel to my satisfaction.
Why, when I am working in a 3 Dimensional World, am I only looking at 2 of them? {Chart}
Where/What is the Third Dimension?
Volume? Not functional in Retail FX.
Open Interest? I would dearly love to have a datastream on that.
First Notice? Insert your own Lengthy explanation here.
Last Trading Day? This is one I can't believe {place tongue firmly in cheek} that borkers don't routinely provide. Even just for the Current/Spot would be sufficient.
{Hey Merlin, that would be a swee...eet addition to the Calendar}
I have worked on this concept numerous times in the past but always end up throwing it back in the drawer till the next time.
What IF:
the chart you are looking at is not actually like a piece of string laid on a pleasingly coloured background but is in fact a Coil {like a spring} sitting on top of said pleasingly coloured background.
{I'm hoping Thom is into this and perhaps can generate some graphics to help explaine}
"I hate Flat Markets !"
What if we look at the Market as not being Flat but is in actuality travelling in the 3rd Dimension?
Either straight toward you or directly away from you.
Would that help in deciding an upcoming move?
Weekend ramblings of sitting in the Home Office cause it's raining and I can't mow the lawn