Chapter 6 - Cross-Market Trading and the Stress Indicator 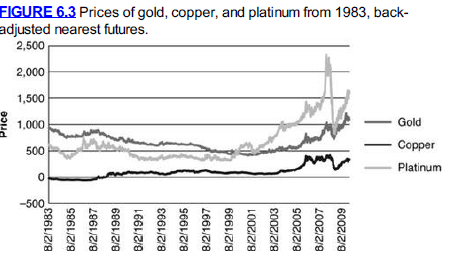
The Test
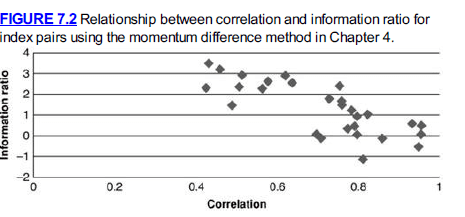
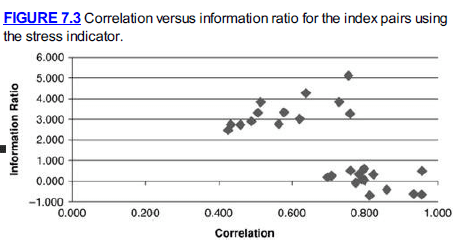
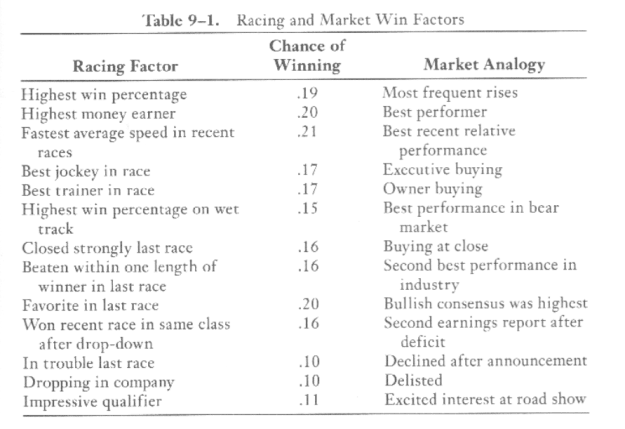
- The stress indi allows identification of buy and sell levels, across different markets, maybe more flexibly than the momentum difference method
- Stat-arb pairs trading has become more difficult
- Widely known method
- Many novice traders don’t know how to balance risks correctly
- Small profit margins with stocks, but more promising in other pairs
- Relative value trading
- Using a stoch indicator, calculate the value of each leg
- See how often the values move apart far enough to offer a profit opportunity
- The stress indi is another way to identify trigger points
The crossover trade
- Identify a business whose primary product is a commodity
- Major oil producers
- Mining operations
- Agribusiness
- Avoid companies that are too diversified because we want dependency on price of the underlying commodity
- More discussion of trading hours - this underscores the importance of knowing this material but it’s likely out of date
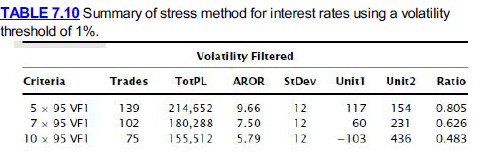
Stress indicator
- Stress is like a rubber band
- The farther we stretch it the harder it pulls to return to its normal shape
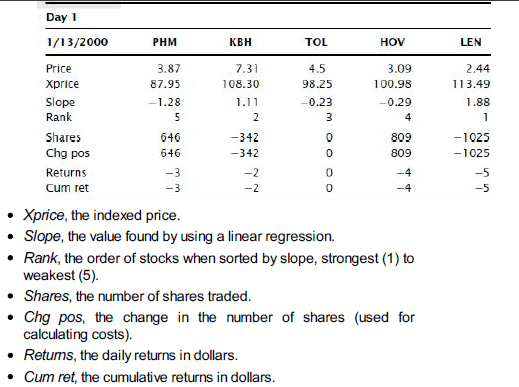
- Calculation
- 1. Find the raw stochastic for leg 1 over an n-day period
- Raw(leg1)today = Close(leg1)today - low(leg1)n-days / High(leg1)n-days - Low(leg1)n-days
- This is effectively the position of today's closing price within the high-low range of the past n – days, measured as a percentage from the bottom of the range. Note that n – days is the entire n – day period.
- 2. Find the raw stoch for leg 2 (same formula)
- 3. Find the difference the two stoch values
- Diff(today) = Raw(leg1)today - Raw(leg2)today
- This is the same procedure as in previous chapter so far but now comes the twist
- 4. Stress(today) = Diff(today) - Low(Diff)n-days / High(Diff)n-days - Low(Diff)n-days
- Even though the Diff values do not have highs and lows each day, the stress indicator can provide added value. There is also no smoothing involved in this calculation, so there is no lag, as there is in most trending indicators.
- Easily calculated using a spreadsheet - I got you
- 1. Find the raw stochastic for leg 1 over an n-day period
- The method of application is the same as before, the difference is this indicator can find a peak/trough with relative values
- PK starts with an oil example but I think his metals example is clearer
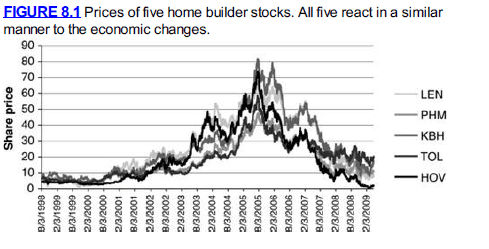
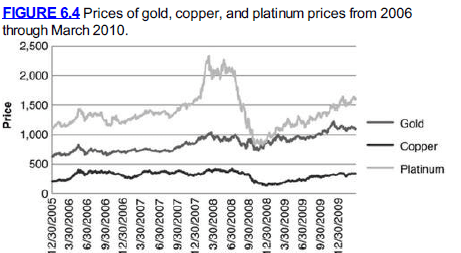
Gold, Copper, Platinum
- Starting with mining stocks (because they are in the news)
- Mining company stock should go up with the price of gold
Trading Rules
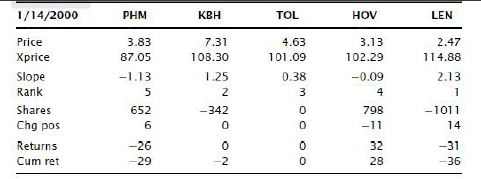
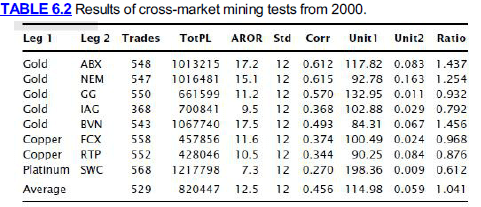
- A 10 year test starting in 2000
- “The stress indicator takes the metal price as leg 1 and the stock price as leg 2.
- The stress indicator will use a 10-day calculation period.
- We sell the metal and buy the company shares when the stress indicator moves over 95.
- We buy the metal and sell the shares short when the stress indicator falls below 5.
- We volatility adjust the position sizes of both legs in order to have the same risk.
- We exit both longs and shorts when the stress indicator crosses 50.”
Dynamics of Changing Parameters
- This is a couple of pages of PK saying that if we change parameters different things will happen; for example changing the exit threshold will change unit returns, and the number of trades
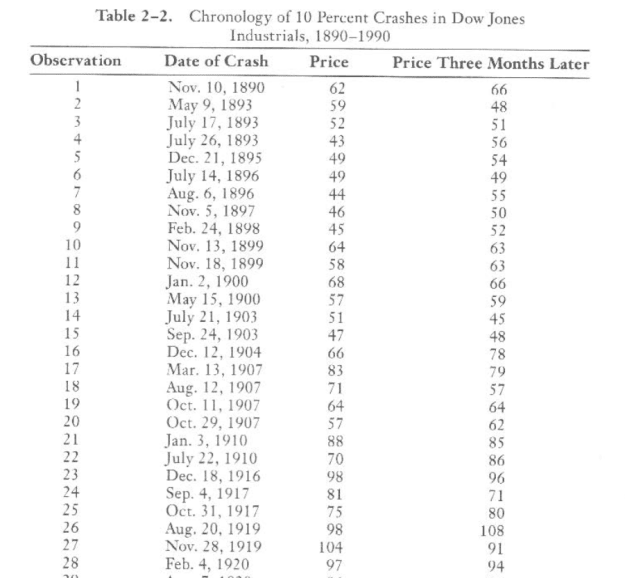
- Attached Image (click to enlarge)

Costs
- “charge the commodity leg $25 for each round turn. We assume stocks can be traded for less than 1 cent per share; therefore, no cost is used for the stock side of the trade”
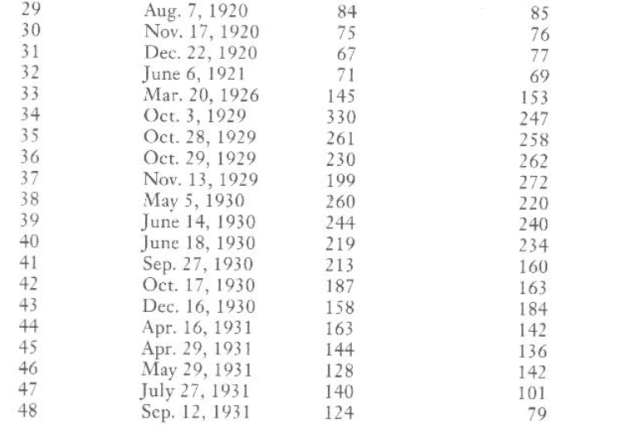
Attached Image (click to enlarge)
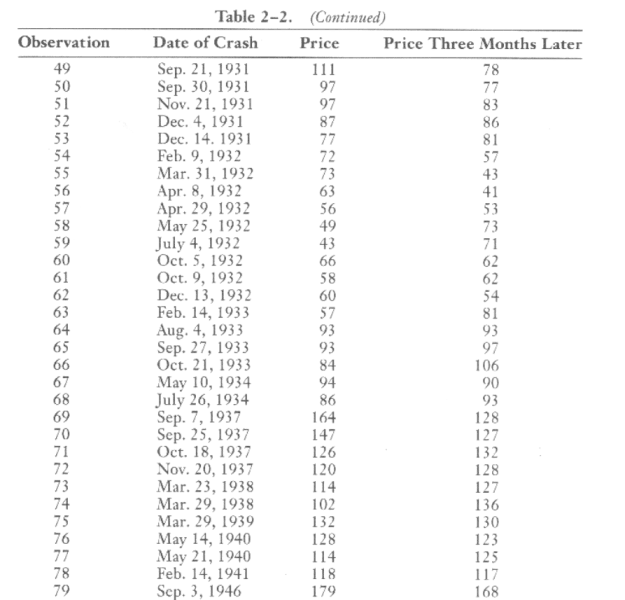
Attached Image (click to enlarge)
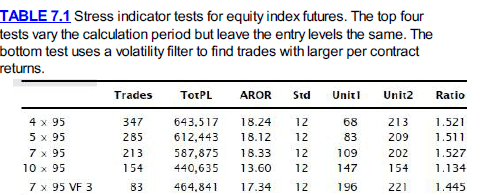
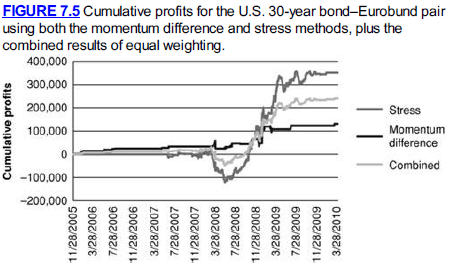
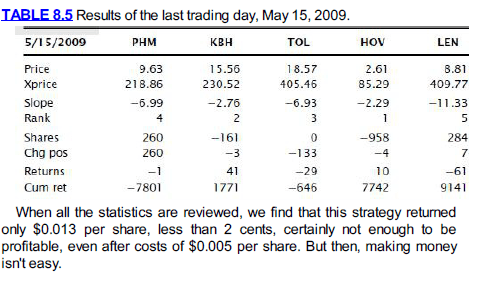
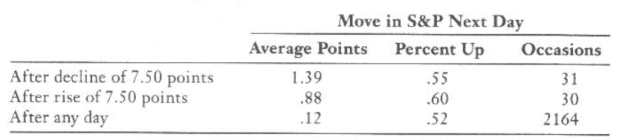
The Test
Attached Image (click to enlarge)
- Overall results are remarkably good, with an average information ratio above 1.0 and an annualized return of 12.5% at an annualized volatility of 12%.
- Running this test from 2010-2020 would be extremely interesting
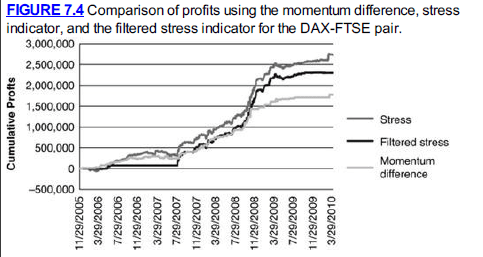
- Again, to improve results, PK recommends trading during higher volatility times, by using a vol filter
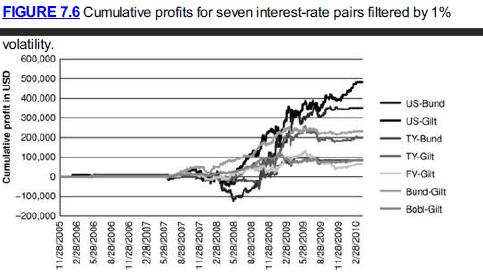
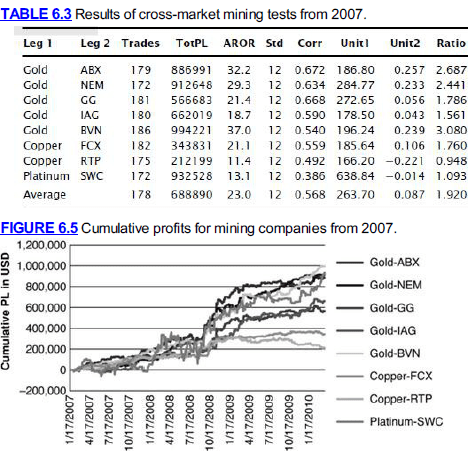
Attached Image (click to enlarge)
- PK repeats the tests with Agribusiness, major energy producers, but I won’t.
- “All trading methods benefit from diversification, and short-term strategies tend to show differences more often than longer-term approaches because they are more sensitive to smaller changes in price moves, resulting in more frequent entries and exits. The cross-market strategy can produce different signals when crude oil is measured against different petroleum companies, but it is far better to incorporate both oil and metals combinations in the same portfolio.”