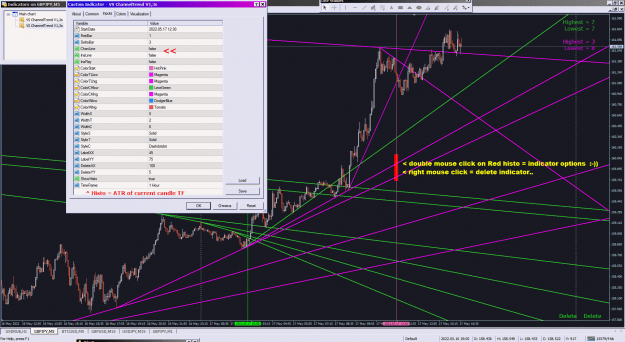
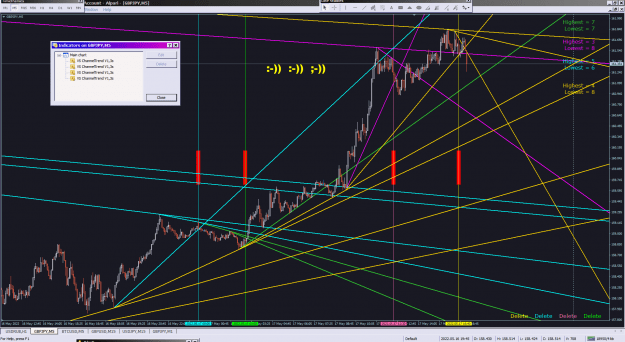
VS ChannelTrend V1,3
if StartDate=1970.01.01 then FirstBar is applied [is using]. Main thing is to choose right start date DeltaBar and InsRay are also important settings...
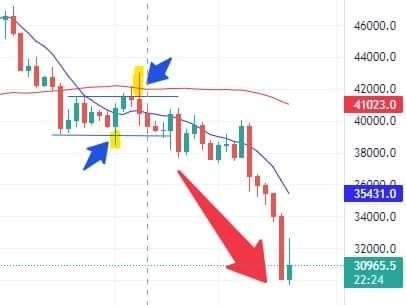
Measure the temperature of the market Like a thermometer .The function of this indicator is to measure the temperature of the market ,it is just like that using a thermometer to measuring water temperature, directly to show where the market is running and where it is likely to reach.
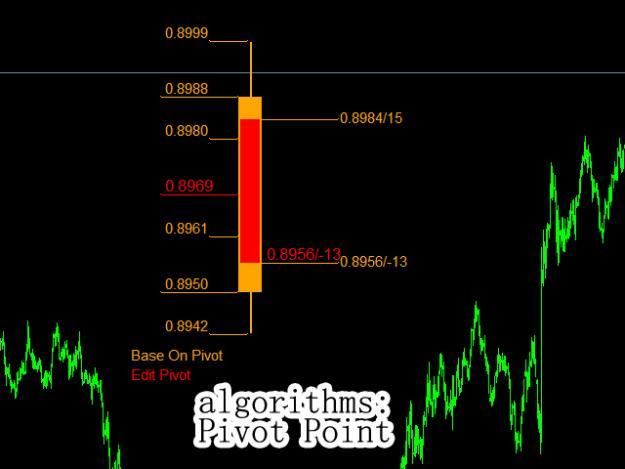
Pivot Point is a resistance and support system. It has been widely used at Forex, stocks, futures, treasury bonds and indexes. It is an effective support resistance analysis system.
Average True Range(ATR) is used to measure the volatility of market prices. ATR represents the actual situation of the market in the past period of time, and in many cases reflects the energy of the recent market.
Market has its own rules,sometimes the market is very gentle, sometimes is very strong waves. Based on Pivot Point and ATR, we can predict the where the market is most likely to go and where it is most likely to back.
This indicator provide two algorithms, Pivot Point and ATR, you can switch between the two algorithms at any time. Pivot Point: P=(LastClose+LastHigh+LastLow)/3; Support Levels: S1=2*P-LastHigh; S2=P-(LastHigh-LastLow); S3=(2*P)-((2*LastHigh)-LastLow); Resistance Levels: R1=2*P-LastLow; R2=P+(LastHigh-LastLow); R3=(2*P)+(LastHigh-(2*LastLow)); the defaut is yersterday's prices, and there have a modified interface to set any price you need. ATR: The ATR value takes yesterday's value and the chart period is D1. it is represents recent market volatility. by the input argument, can set the period of ATR. User Inputs: ATR Period - set here the Average True Range period , it can be 1,2,3..14. . Ratio of ATR to Alert - set here the ratio you want to show in the monitor,default is 0.5, more than 0,and not greater than 2 X Distance - set here the x distance. Y Distance - set here the y distance. Thermometer Height - set here the Thermometer height. Thermometer Width - set here the Thermometer width. Thermometer0 color - set here the color. Thermometer1 color - set here the color. Font color1 - set here the color. Font color2 - set here the color.
Attached Image (click to enlarge)
Ignored
Candle_Temperature
OCLH prices w tick volume relations....
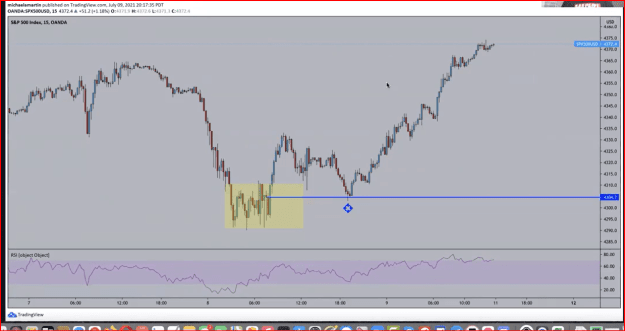
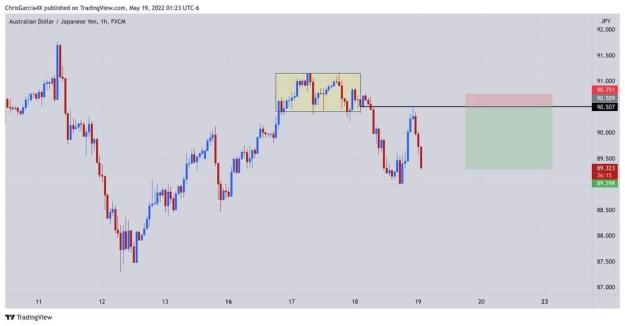
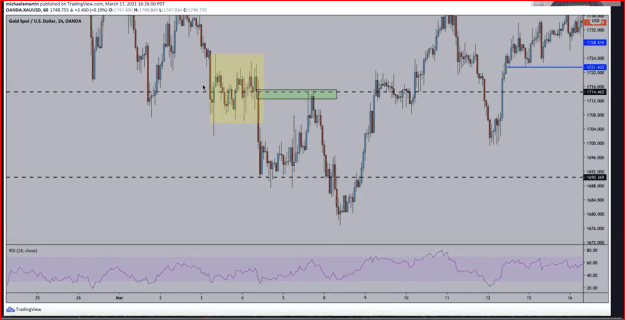
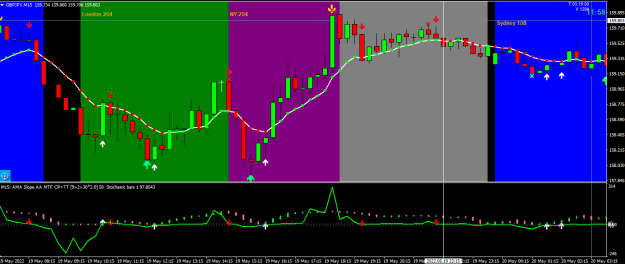
@ Sir Tankk, Good day Sir, please i have a situation, someone is using these strategies even used it to have a community trading, i dont know how to explain these strategies but is it possible to help code? especially the last picture
Good day Sir please i am sorry to bother you again with this indi, please only at your free time
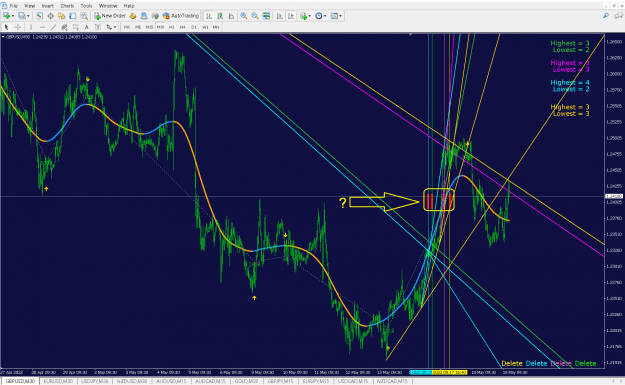
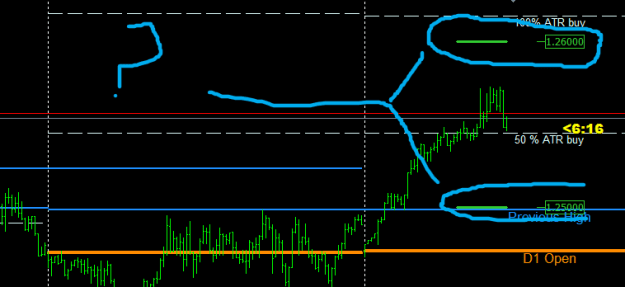
i have been noticing this round levels for sometime now, can you make it print as part of the history?
i want to know if its everytime when price start from one round levels it will get to the next and how often this happens, maybe i can use as entry points, please help to update this indi with the round levels as history
{quote} Good day Sir please i am sorry to bother you again with this indi, please only at your free time i have been noticing this round levels for sometime now, can you make it print as part of the history? i want to know if its everytime when price start from one round levels it will get to the next and how often this happens, maybe i can use as entry points, please help to update this indi with the round levels as history {image}
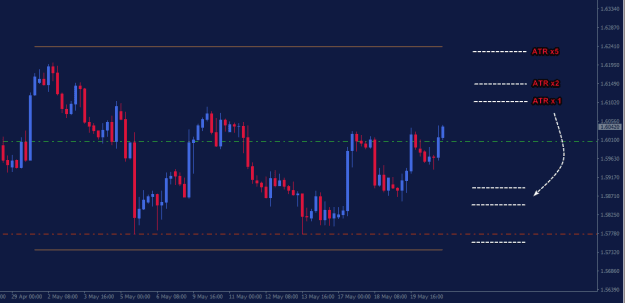
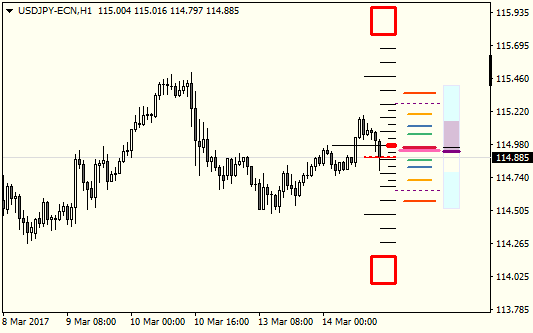
Hey Team, I am in search for an ATR indicator.. what I need: ATR based on EMA not SMA (maybe with a setting to change it?) 3 added multiplication options ( ATR x 1, x 2, x5 for example) Those levels then are shown on the chart (similar as to ADR levels) {image}
will broken in any moment
{image} {file}
Ignored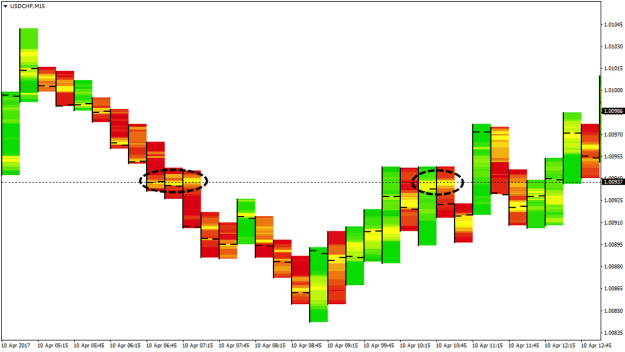
![Click to Enlarge
Name: Candle+Temperature+Indicator [некто] 2018-09-03.jpg
Size: 120 KB](/attachment/image/4208178/thumbnail?d=1653039327)