If you are a one-tool guy and don't like tool boxes, then stop here and return to the Forums overview (https://www.forexfactory.com/forums) -- this thread is not for you and you will not only be wasting your time, but mine as well. On the other hand, if you like learning something new and not afraid to learn something that is not only new but rather "alien" compared to the way you've currently been trading, then read on. And to be clear, I'm not pushing Focal Points as the next Holy Grail. It is another style of trading you may find fun and intriguing that breaks-up the boredom of endless screen-staring.
I recently learned about Focal Points from @parisboy in the PlanetX thread (https://www.forexfactory.com/thread/...tx-oscillators). @parisboy is a brilliant man with a great sense of humor and an expert on envelopes, waves and cycles (https://www.forexfactory.com/thread/...s-waves-cycles?). I've known him a few years and read his posts from time-to-time, though they generally fly over my head. My brain marches to an empirical beat, whereas @parisboy's is more theoretical. However, during our recent engagement on the PlanetX thread a few things began to click. I asked a few questions, received nice responses, and then more began to click. And then, at one point, a light bulb went on. Focal Points are super, super easy to trade, plus they are colorful and visually pleasing to the eye. However they aren't used the way you think they might be used -- and that is the catch. If you read the first few posts here and think you understand then, for sure, you don't. You'll need to re-read until that light bulb goes on.
I've developed a new Focal Point indicator that I will share and explain its use in a post below.
I should also emphasize early on that trading Focal Points is highly discretionary -- you will need to use your brain's pattern-recognition capabilities. The Focal Point strategy does not lend itself to automation -- so, don't expect a future EA.
Full disclosure: Focal Points are new to me and as of this writing I have not yet traded them -- I'm an algorithmic trader. However, I plan to incorporate Focal Points into my discretionary trading.

################################################################################
Update: 2022-03-23 (Taken from post #88)
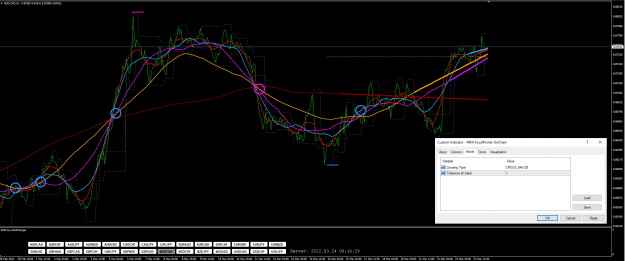
This post includes an updated version of the R4M-FocalPoints-OnCharts indicator. Using the default settings it does a good job of detecting Focal Points -- though I won't claim it is perfect. As I've touched on above, not all Focal Points are created equal -- at least not visually. The SMA intersections rarely occur at exactly one point -- there is always a bit of a horizontal or vertical offset. Your brain can easily spot the colorful pattern and ignore its imperfections, but that's not so easily done in code without very specific, predefined rules -- that currently don't exist. So, I came up with my own and it seems to work. I am happy to continue refining the detection algorithm. However, if you come across a discrepancy where the detection is wrong or misses an obvious FP then it's okay to complain -- as long as you include a chart that points to the discrepancy and provides enough information that would allow me to reproduce it. If I can't reproduce a problem then I can't fix. Also, I'm not a mind-reader.
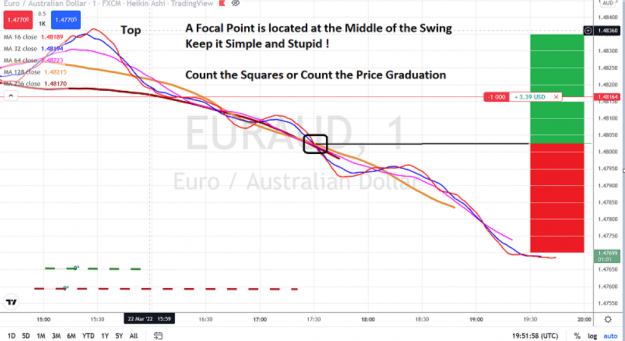
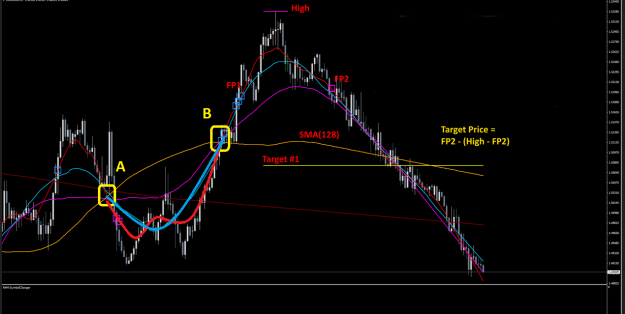
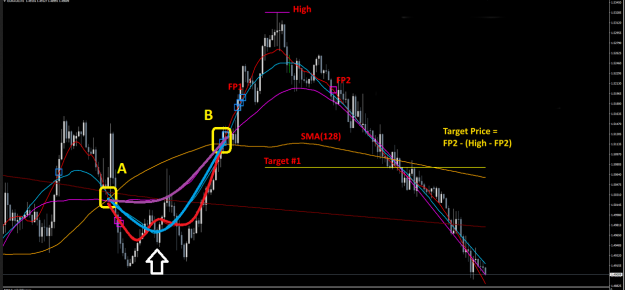
Let me explain a few of the indicator's features. In the image below the bullish and bearish FPs that the indicator detected are marked by blue and purple circles, respectively. I think of Focal Points in terms of pairs (i.e. couples) of a bullish one coupled with a bearish one. I'll call these FP1 and FP2. In between FP1 and FP2 there will be either a High or a Low. When FP1 is bullish and FP2 is bearish there will be a High, and when FP1 is bearish and FP2 is bullish then there will be a low. Once FP2 is formed the indi has enough information to compute the TargetPrice (yellow line). If current price has not yet reached the guesstimate TargetPrice then the yellow line is solid and may still be valid. However, once the current price has exceeded the guesstimate TargetPrice then it should no longer be considered and it is drawn as a dashed line.
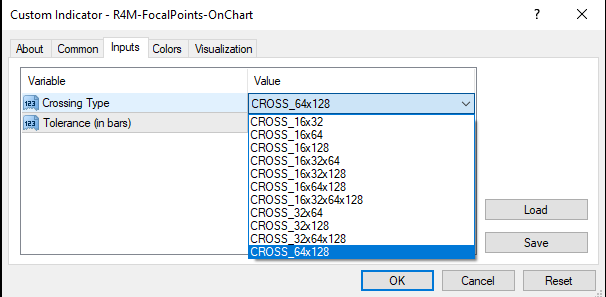
The updated version of the indicator includes two settings: 'Crossing Type' and 'Tolerance'. These come about because, as mentioned above, not all Focal Points are created equal and are described below:
Crossing Type: There are 11 crossing types -- 16x32, 16x64, 16x128, 16x32x64, 16x32x128, 16x64x128, 16x32x64x128, 32x64, 32x128, 32x64x128, 64x128. The default is 64x128, since I think that works best. But feel free to experiment with the others.
Tolerance: This is the "breathing room" required by the detection algorithm. Intersecting SMAs occur in close proximity to one another, but not at an exact point. This setting is the number of bars that intersecting SMAs are considered to belong to the same FP. The smaller the number the more strict. In the case of 64x128 the Tolerance can be set to '1' since there is only one crossing. In the case of 16x32x64x128 if you use a setting of '1' then you will probably not see any FPs.
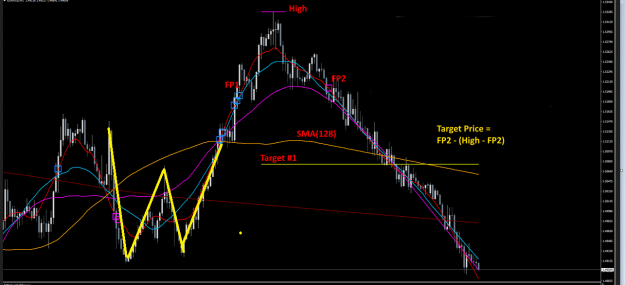
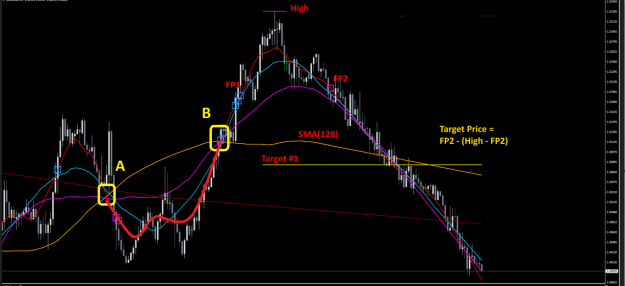
Below is an example of a bearish FP where the guesstimated Target Price may still be trade-able because it hasn't yet been exceeded by the current price.
And some tips:
1. Pay attention to the Fractal Channels you see in the background.
2. Pay attention to SMA(128).
3. Trade in the direction of SMA(128).
4. Perhaps it's best to attach the indi twice to a chart -- one using 64x128 and the other 16x128, each using a 'Tolerance' of 1.
Don't force it -- if a candidate setup isn't obvious and you feel like you have to ask @parisboy whether or not to enter a trade, then that is your clue not to trade it. When you get your head around this algorithm you won't need to ask questions. If you feel a need to ask questions then that probably means you don't yet have your head around it. I would consider this a highly discretionary strategy. The indicator I've provided is just a tool -- it can not guide your hand to the BUY / SELL button. A tool is only as good as the craftsman who holds it.
################################################################################
Update: 2022-03-24 (Taken from post #136)
Here is a new indicator -- R4M-GuppyPoints-OnChart. It is a new concoction that combines the idea behind Focal Points with Daryl Guppy's GMMA (Guppy Multiple Moving Average). The results are similar to FocalPoints and though it may ruffle some feathers, I actually think they are better. I'll explain why below...
GuppyPoints lacks the rich history and theory of FocalPoints, though it does share some similarities. Whereas FocalPoints relies on multiple SMA lines that differ by powers-of-two, GuppyPoints relies on multiple EMA lines who's periods don't follow any particular pattern, as far as I can tell. I suspect they were chosen by empirical observation -- i.e. trial and error. GuppyPoints uses two groups of EMA lines -- long and short. The periods of the long group are 30, 35, 40, 45, 50, 60, and the periods of the short group are 3, 7, 10, 12, 15. In addition, there is no backshift -- which is a YUUUUGE benefit. Hence, there is no extrapolation or extension since the lines reflect the real-time data all the way to the current bar (Bar[0]). In addition, from a programmatic point of view, the rule for detecting crossings is much simpler and does not require a 'Tolerance' or 'Crossing Type' setting. All intersections are created equal.
I am NOT advocating the use of GuppyPoints over FocalPoints. I am simply sharing an observation -- make of it as you will.
I recently learned about Focal Points from @parisboy in the PlanetX thread (https://www.forexfactory.com/thread/...tx-oscillators). @parisboy is a brilliant man with a great sense of humor and an expert on envelopes, waves and cycles (https://www.forexfactory.com/thread/...s-waves-cycles?). I've known him a few years and read his posts from time-to-time, though they generally fly over my head. My brain marches to an empirical beat, whereas @parisboy's is more theoretical. However, during our recent engagement on the PlanetX thread a few things began to click. I asked a few questions, received nice responses, and then more began to click. And then, at one point, a light bulb went on. Focal Points are super, super easy to trade, plus they are colorful and visually pleasing to the eye. However they aren't used the way you think they might be used -- and that is the catch. If you read the first few posts here and think you understand then, for sure, you don't. You'll need to re-read until that light bulb goes on.
I've developed a new Focal Point indicator that I will share and explain its use in a post below.
I should also emphasize early on that trading Focal Points is highly discretionary -- you will need to use your brain's pattern-recognition capabilities. The Focal Point strategy does not lend itself to automation -- so, don't expect a future EA.
Full disclosure: Focal Points are new to me and as of this writing I have not yet traded them -- I'm an algorithmic trader. However, I plan to incorporate Focal Points into my discretionary trading.
Attached Image (click to enlarge)
Attached File(s)
################################################################################
Update: 2022-03-23 (Taken from post #88)
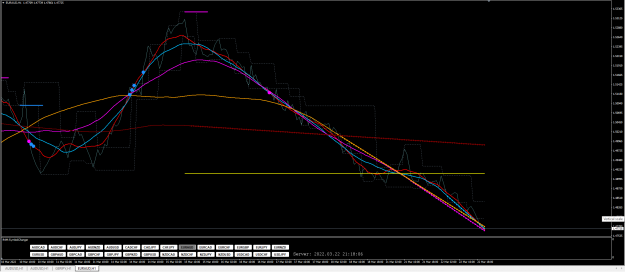
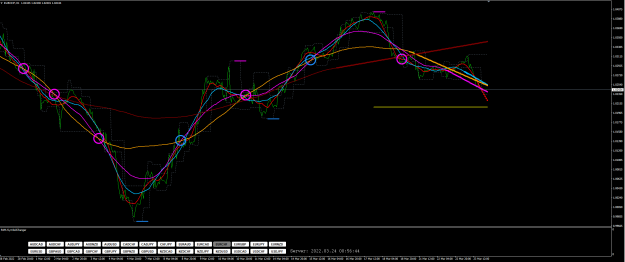
This post includes an updated version of the R4M-FocalPoints-OnCharts indicator. Using the default settings it does a good job of detecting Focal Points -- though I won't claim it is perfect. As I've touched on above, not all Focal Points are created equal -- at least not visually. The SMA intersections rarely occur at exactly one point -- there is always a bit of a horizontal or vertical offset. Your brain can easily spot the colorful pattern and ignore its imperfections, but that's not so easily done in code without very specific, predefined rules -- that currently don't exist. So, I came up with my own and it seems to work. I am happy to continue refining the detection algorithm. However, if you come across a discrepancy where the detection is wrong or misses an obvious FP then it's okay to complain -- as long as you include a chart that points to the discrepancy and provides enough information that would allow me to reproduce it. If I can't reproduce a problem then I can't fix. Also, I'm not a mind-reader.
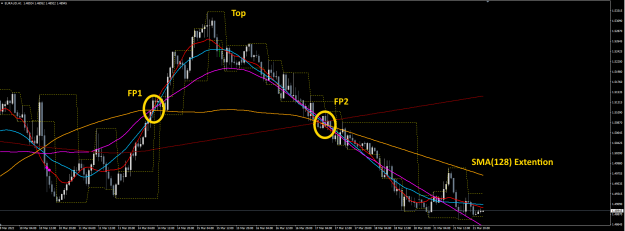
Let me explain a few of the indicator's features. In the image below the bullish and bearish FPs that the indicator detected are marked by blue and purple circles, respectively. I think of Focal Points in terms of pairs (i.e. couples) of a bullish one coupled with a bearish one. I'll call these FP1 and FP2. In between FP1 and FP2 there will be either a High or a Low. When FP1 is bullish and FP2 is bearish there will be a High, and when FP1 is bearish and FP2 is bullish then there will be a low. Once FP2 is formed the indi has enough information to compute the TargetPrice (yellow line). If current price has not yet reached the guesstimate TargetPrice then the yellow line is solid and may still be valid. However, once the current price has exceeded the guesstimate TargetPrice then it should no longer be considered and it is drawn as a dashed line.
Attached Image (click to enlarge)
The updated version of the indicator includes two settings: 'Crossing Type' and 'Tolerance'. These come about because, as mentioned above, not all Focal Points are created equal and are described below:
Crossing Type: There are 11 crossing types -- 16x32, 16x64, 16x128, 16x32x64, 16x32x128, 16x64x128, 16x32x64x128, 32x64, 32x128, 32x64x128, 64x128. The default is 64x128, since I think that works best. But feel free to experiment with the others.
Tolerance: This is the "breathing room" required by the detection algorithm. Intersecting SMAs occur in close proximity to one another, but not at an exact point. This setting is the number of bars that intersecting SMAs are considered to belong to the same FP. The smaller the number the more strict. In the case of 64x128 the Tolerance can be set to '1' since there is only one crossing. In the case of 16x32x64x128 if you use a setting of '1' then you will probably not see any FPs.
Attached Image (click to enlarge)
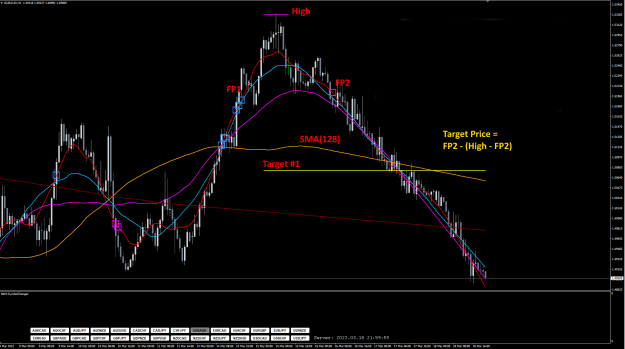
Below is an example of a bearish FP where the guesstimated Target Price may still be trade-able because it hasn't yet been exceeded by the current price.
Attached Image (click to enlarge)
And some tips:
1. Pay attention to the Fractal Channels you see in the background.
2. Pay attention to SMA(128).
3. Trade in the direction of SMA(128).
4. Perhaps it's best to attach the indi twice to a chart -- one using 64x128 and the other 16x128, each using a 'Tolerance' of 1.
Don't force it -- if a candidate setup isn't obvious and you feel like you have to ask @parisboy whether or not to enter a trade, then that is your clue not to trade it. When you get your head around this algorithm you won't need to ask questions. If you feel a need to ask questions then that probably means you don't yet have your head around it. I would consider this a highly discretionary strategy. The indicator I've provided is just a tool -- it can not guide your hand to the BUY / SELL button. A tool is only as good as the craftsman who holds it.
################################################################################
Update: 2022-03-24 (Taken from post #136)
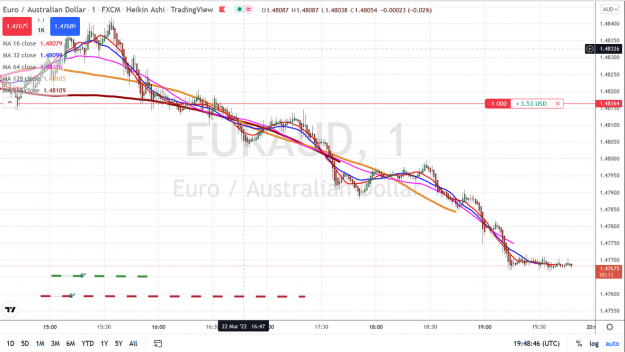
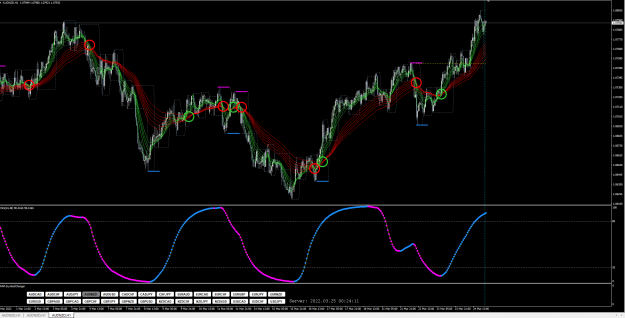
Here is a new indicator -- R4M-GuppyPoints-OnChart. It is a new concoction that combines the idea behind Focal Points with Daryl Guppy's GMMA (Guppy Multiple Moving Average). The results are similar to FocalPoints and though it may ruffle some feathers, I actually think they are better. I'll explain why below...
Attached Image (click to enlarge)
Attached File(s)
GuppyPoints lacks the rich history and theory of FocalPoints, though it does share some similarities. Whereas FocalPoints relies on multiple SMA lines that differ by powers-of-two, GuppyPoints relies on multiple EMA lines who's periods don't follow any particular pattern, as far as I can tell. I suspect they were chosen by empirical observation -- i.e. trial and error. GuppyPoints uses two groups of EMA lines -- long and short. The periods of the long group are 30, 35, 40, 45, 50, 60, and the periods of the short group are 3, 7, 10, 12, 15. In addition, there is no backshift -- which is a YUUUUGE benefit. Hence, there is no extrapolation or extension since the lines reflect the real-time data all the way to the current bar (Bar[0]). In addition, from a programmatic point of view, the rule for detecting crossings is much simpler and does not require a 'Tolerance' or 'Crossing Type' setting. All intersections are created equal.
I am NOT advocating the use of GuppyPoints over FocalPoints. I am simply sharing an observation -- make of it as you will.