Does anybody know a solution (indicator, script or entire platform) to create charts with very uncommon timeframes?
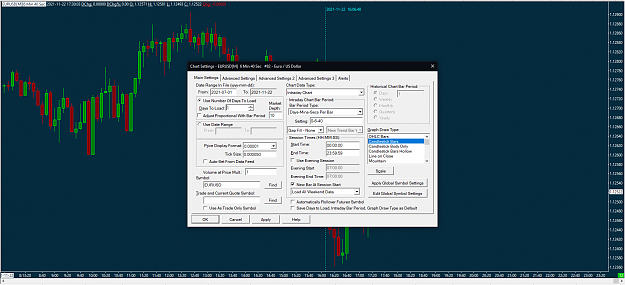
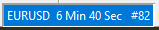
A chart with 6 Minutes and 40 seconds candles (1/9 of an hour), and 2 hours and 40 minutes (1/9 of a day).
A chart with 6 Minutes and 40 seconds candles (1/9 of an hour), and 2 hours and 40 minutes (1/9 of a day).