Have a toolbox - Use What Works for the Current Market Environment
Step #1: Determine the Trading Environment
Rules to Determining Trading Environment
Time to mess up your charts with indicators 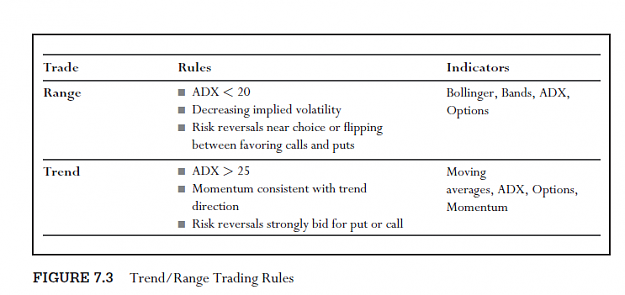
Since this information is actually valuable, you won’t find it anywhere but in expensive packages like the Bloomberg terminal.
Step #1: Determine the Trading Environment
Rules to Determining Trading Environment
Time to mess up your charts with indicators
- Indicators suck, etc,
- currency market obeys technical analysis particularly well, given its large scale and number of participants. (yes, 50% of the time!)
- Every instrument is either ranging or trending, etc.
- To detect ranging:
- ADX < 20
- Decreasing implied volatility - KL tracks short-term vs. long-term vol
- When short-term vol falls after a burst above long-term vol that’s a signal of return to range
Oh never mind there’s a graph
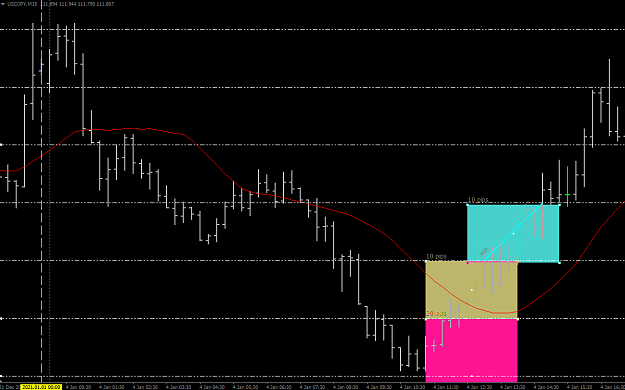
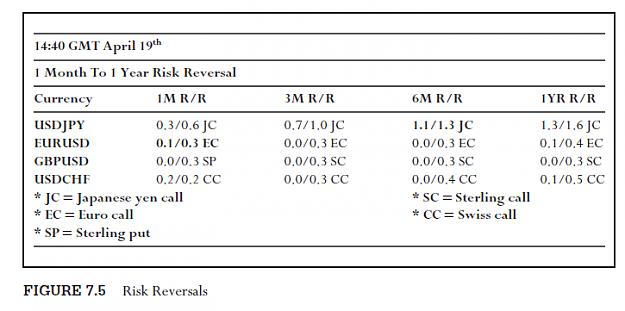
Attached Image (click to enlarge)
- Risk reversals flipping between calls and puts. Far out of the money options should have the same nominative value but in practice they don’t as the market has some bias usually in one direction or the other. So risk reversals options can act like a sentiment indicator for FX
- In ranges risk reversals tend to flip back and forth between favoring calls and puts
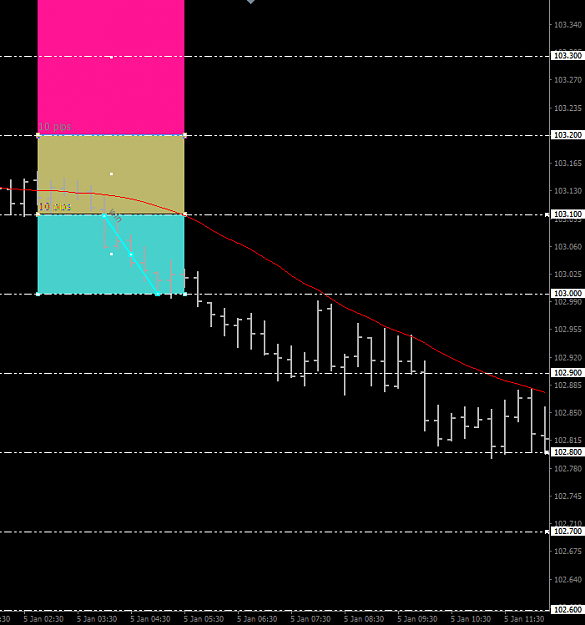
Attached Image (click to enlarge)
Since this information is actually valuable, you won’t find it anywhere but in expensive packages like the Bloomberg terminal.
- To detect trending
- ADX > 20
- Momentum in trend direction as measured by RSI, MACD, stochastics
- Momentum index is less popular or reliable
- The best indicator says KL is a ‘perfect order’ of moving averages
- When 10, 20, and 50 day SMA are all moving upwards that’s a bull trend
- If the 100 day SMA and 200 day SMA are below the other averages
- Could check but I know what we’ll see - laggy signals
- Risk reversals should strongly favour either calls or puts
Step 2 - Determine the time frame for the trade
Intraday Trade (range) rules:
- Use hourly charts to find entry and daily charts to confirm a range trade exists on the longer TF
- Use oscillators to determine entry points within range
- Look for short-dated risk reversals to be ‘near choice’
- Look for reversal in osc (RSI/stoch at extremes)
- Trade stronger when prices fail at key resistance
- Use fib retracement points and MAs
Indicators used:
Stochastics, MACD, RSI, Bollinger Bands, options, Fib retrace levels (good grief)
Medium term range trade rules:
- Use daily charts
- Position for upcoming range trading opportunities or get involved in an existing range
- Upcoming: look for high vol environments, where short-term vol is higher than long-term
- Look for reversion back to the mean
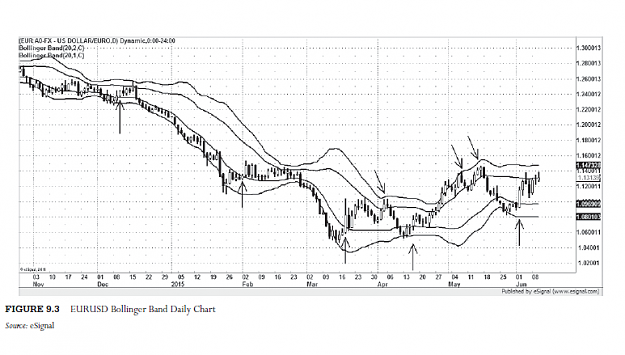
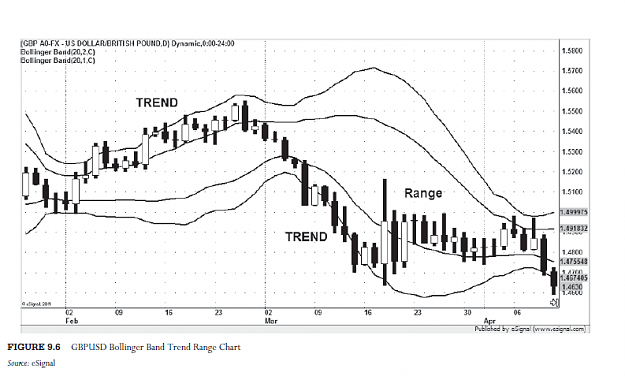
- Existing: Use Bbands to identify existing ranges
- Look for reversals in RSI/stoch
- ADX < 25 and falling
- Look for medium-term risk reversals near choice
- Confirm with failure at key range resistance and bounce on key range support
- Indicators: same
Medium-term trend trade rules:
- Look for ranges on daily charts and use weekly charts for confirmation
- Check for trending environment
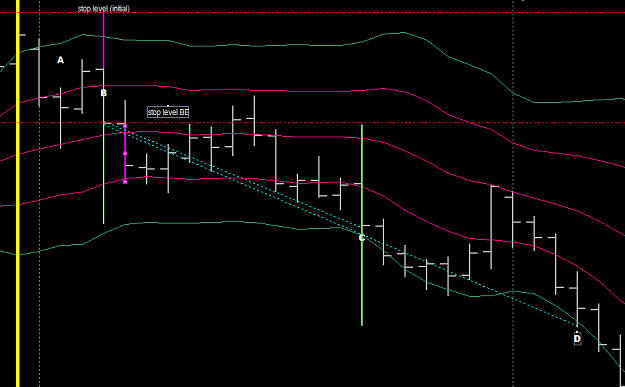
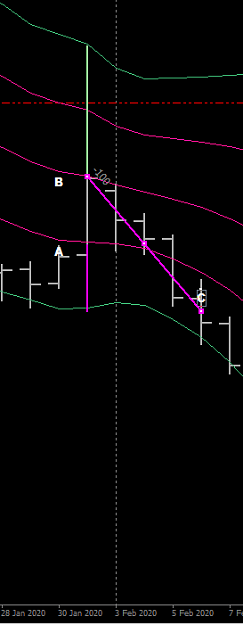
- Buy breakout/retracement scenarios on key fib levels or moving averages
- Look for no major resistance levels in front of trade
- Look for candlestick pattern confirmation
- Look for MA confluence to be on same side of trade
- Enter on break of significant high or low
- Wait for volatilities to contract, ideally
- Look for supporting fundamentals - a string of surprises or disappointments
Indicators:
ADX, PSAR, RSI, Ichimoku, Elliott waves, Fibonacci
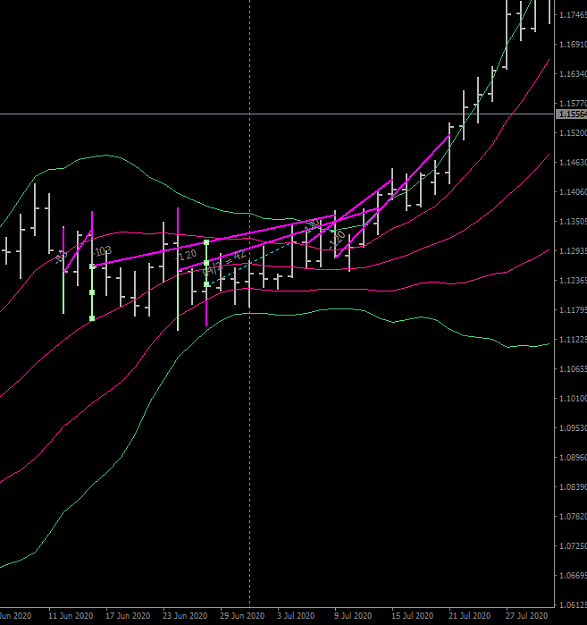
Medium-term breakout trade rules:
- Use daily chart
- Look for contract in short-term vol to a point where it is sharply below long-term vol
- Use pivot points to determine if a break is true/false
- Look for MA confluence to support the trade
Indicators:
Bollinger, moving averages, Fibonacci
This is not the content I signed up for.
3