Interestingly, the TOC says there should be an introduction here (like in the other parts) but there isn’t. I wonder if DT even bothered having this proofread?
Chapter 12 - The market in perspective
- TA sucks
- Close stops suck
- FA is trading news
- Forex brokers propagate these schemes to get traders to trade more
- More trading is more profits for them
- BUT DT is not saying he doesn’t use TA or FA but just that he uses it in the ‘proper context’. Are we going to get some of that context soon...
A birdseye view
DT is back in storytelling mode telling us about some soccer team or something…
- You need to have the right perspective
- Just guessing - long term?
The G-Force of the FX Market
- Currencies revert
- Stocks go up or go down to zero
- The tendency to mean reversion DT calls the g-force
- DT bases his trading on ‘sound statistical principles’ but doesn’t bother telling us what those are
The Median Grid
- The market moves up, down or sideways
- After a strong move usually a retracement or a sideways move
- Hard to spot the transitions - it takes weeks to say with certainty
- The terms overshoot and pull back are in reference to the median price range
- Works best if the market is in a sustained sideways move
- The median grid is a ‘context creator’
- You have to view the market in terms of price ranges
- A range is a bit of price movement that is mostly random
- In trading rules of thumb work but precision does not
- The ranging area is the median grid
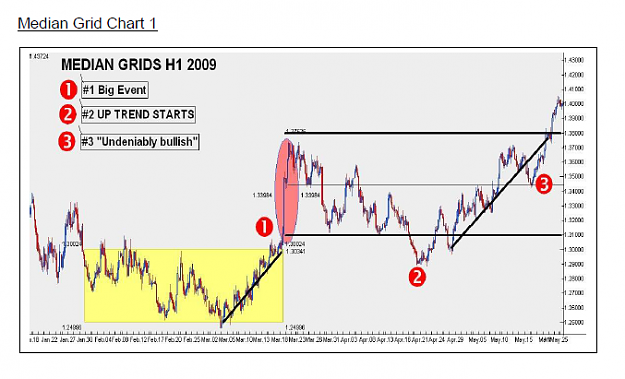
An actual trading chart appears!
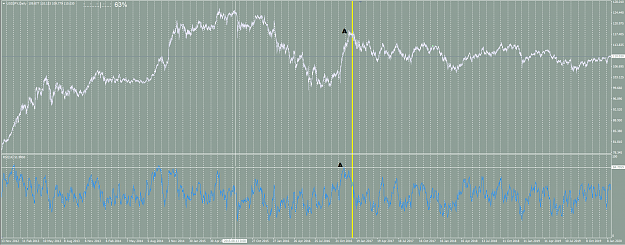
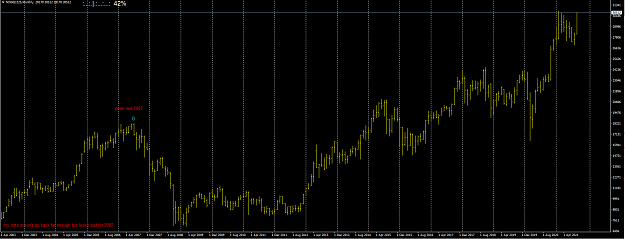
EURUSD H4 Jan. - Jun. 2009
- DT highlights an area in yellow that he wants you to ignore
- The red oval is a Fed announcement. The big candle move happened in ‘10 minutes’.
- Prior to this price was in a range mostly staying below 1.3000 with the majority between 1.25-1.30 - this yellow block was a ‘median grid’
- The ‘big event’ causes a transition to a new range
- Here I find DT gets maddeningly vague again.
- We have to be ‘forward-looking’ to establish a median grid.
- But the way it’s established after the ‘big event consists of waffling - here I’ll just transcribe it in full.
“It doesn't make sense to work with a grid that doesn't contain current prices and doesn't leave room for continuation of the immediate trend. The immediate Fed spike was from 1.3100 to 1.3350. One must assume that if prices get with any sort of momentum back to 1.3350 it can just as easily fall to 1.3100 because there obviously were no volume there. This morning there was a fake attempt to new highs but that is now beaten back somewhat as I write, euro at 1.3670 is about the level where the quick move originated. It will be way too early to assume this is a top of this move just because there is a pause, but I would suggest that if we end today like below 1.3600 we might get away with a grid 1.31 - 1.38. Otherwise we will have to look at 1.3300 - 1.4000. Because my advice is to rather stay on the sidelines to see how this unfolds for another day or two this decision can also wait a bit.”
Then DT pats himself on the back for having one of those predictions come true.
Do you understand how to draw the median grid yet? Neither do I.
On May 19th (point 3 on the chart) he tells his subscribers
“We are back to upper levels of the current grid without a visit to the lower levels and this on the back of improving sentiment and a view that the worse of the economic downturn in terms of GDP is behind us. (And still all the credit crunch risks are exactly the same.) There just seems to be loads of money ready to bet on better times, not wanting to miss the boat. I am pretty sure there are much more where this comes from thus while there may be set backs, you can bet your bottom dollar dip-buying may be the order the day across all markets. For the euro this is good because the euro is the anti-dollar and the dollar will have only some temporary strength on a serious spell of US based investment flows on the recovery theme and probably the Fed will lead the interest rate hike charge initially - that would also be USD positive. But those aren't things that will happen soon. The bias is undeniably bullish at this stage. If we can settle in a range where the risks referred to above by UBS will limit risk taking while euro is high and the levels where dips will be bought and euro is low then we will have it made for now.”
Which sounds a lot like the waffling weaselly namby pamby stuff all tips newsletters offer. Yes he did announce he was bullish and yes price went up. But this shows me nothing.
His following posting talks about the difficulty of finding resistance levels because of this big move, a lot of ‘I think’ and ‘I thought’, and how the narrowing range ‘may’ be at some level, but he doesn’t know how ‘real’ that is in terms of current positioning. He never commits to a certainty (wisely) but what value is all this verbiage? About as much as I’m finding in the book I reckon.
“Here is a rule of thumb I use when considering a grid adjustment. Often price finds resistance about ½ a grid outside the existing grid. Therefore in a trending scenario your typical adjustment would be a quick ½ a grid (300 pips) with a bias to adjust another half (300 pips) (assuming approximate grid size based on volatility and current ranges is 600 pips).”
I have had similar thoughts with US equities - that they advance about 50% above their last high before retracing, and this is of course, the most popular Fib level. I won’t bother testing it because I already know how often this is going to work out - about ⅔ of the time. It’s the times when it doesn’t work out that will get you though.
DT goes on to say the grid should be adjusted up to about 1.45. However he still hasn’t told us what use the grid is to us? What do we do when price leaves or is rejected at the grid top or bottom? What function does it serve?
Setting up a Median Grid
- DT says there’s no place for rigid thinking in this strategy - which I’m guessing is a warning that everything here is going to be vague AF.
- The market is ‘quicksilver’ impossible to pin down and categorize
- The grid is not a predictive tool or a TA study, but still, ‘very important’
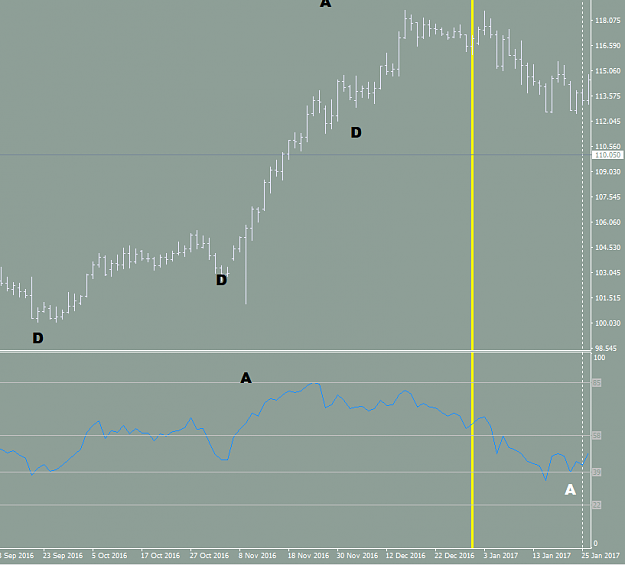
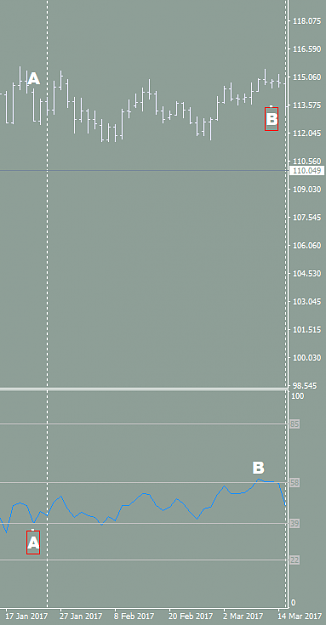
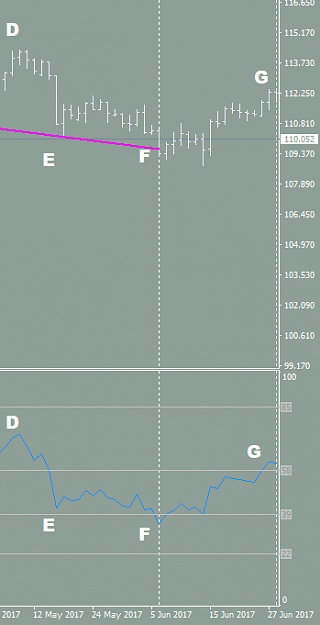
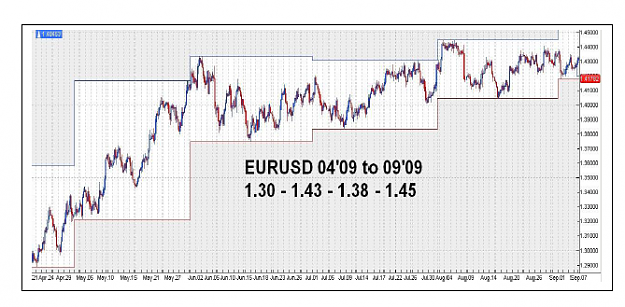
- Start by zooming out to a multi-year view, and then zoom closer to the last year/half-year and finally the last few months
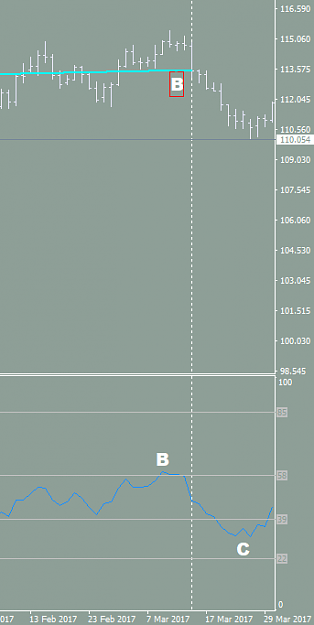
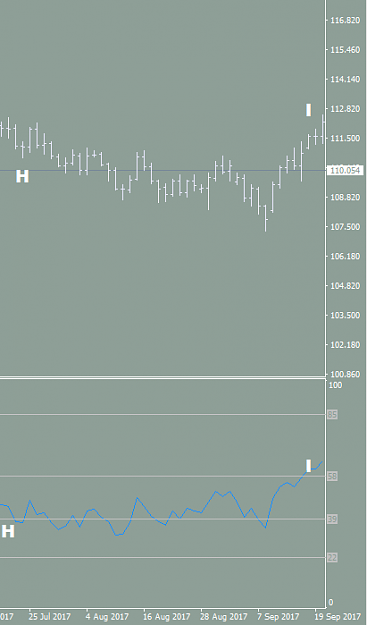
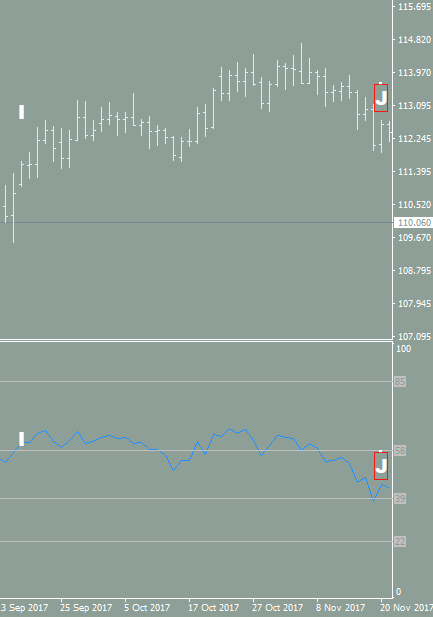
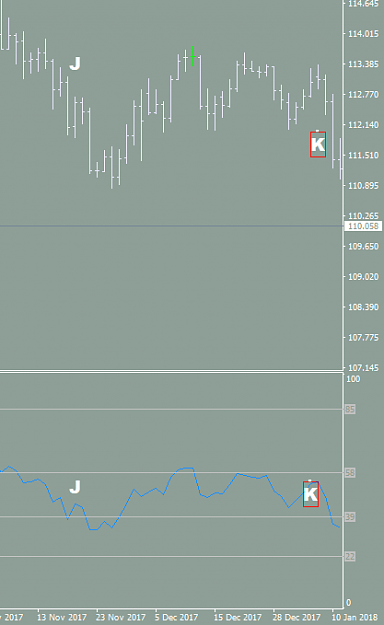
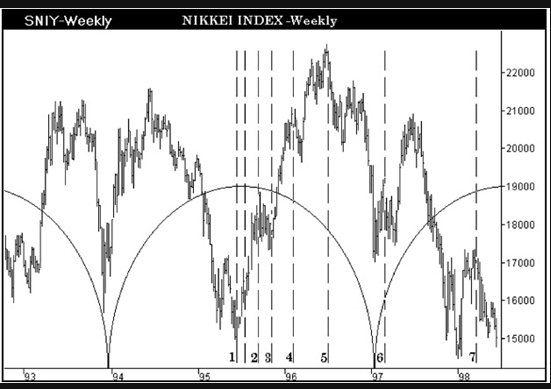
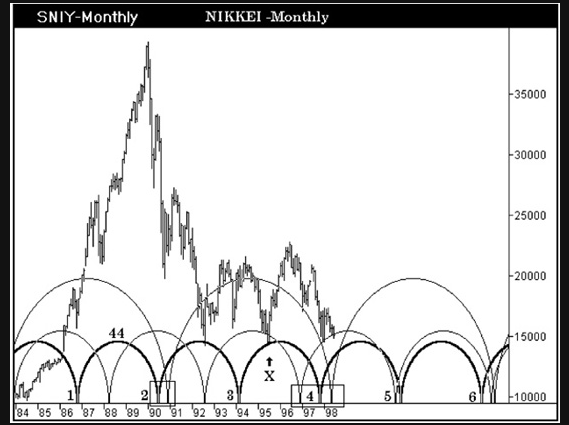
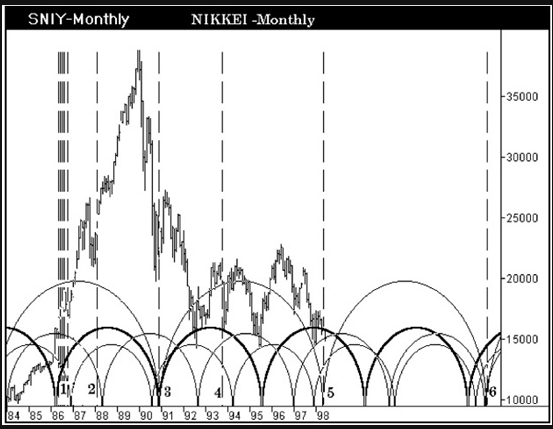
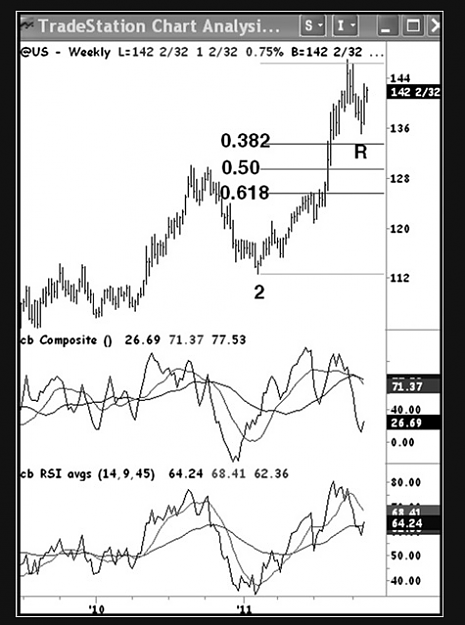
DT shows us four charts
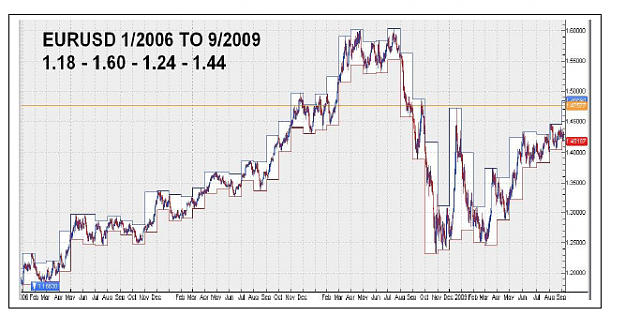
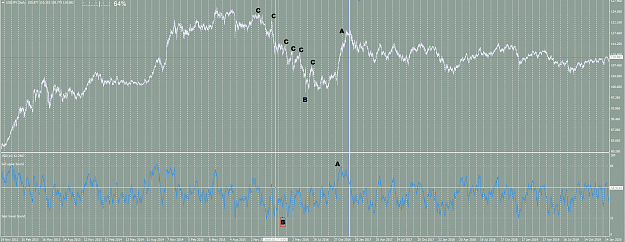
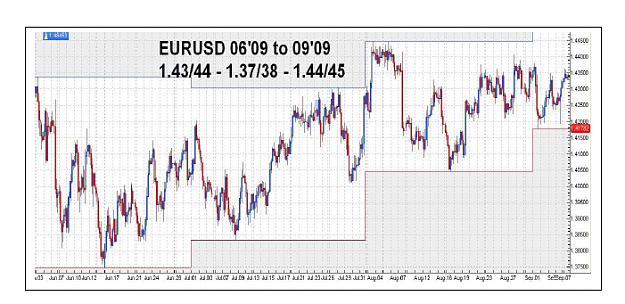
2006-2009
Dominated by an uptrend of 2 years+, ranging for 5 months, and then a ‘spectacular’ drop returning nearly all the gains, a vicious one month up, and then two months down spike to the lows at 1.25. Then a ‘strong’ uptrend from 1.25 to nearly 1.45, exiting the range at 1.5050
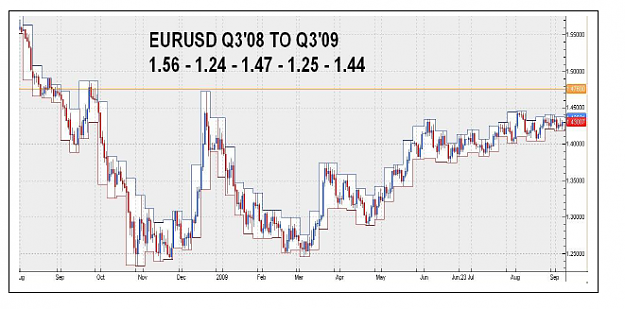
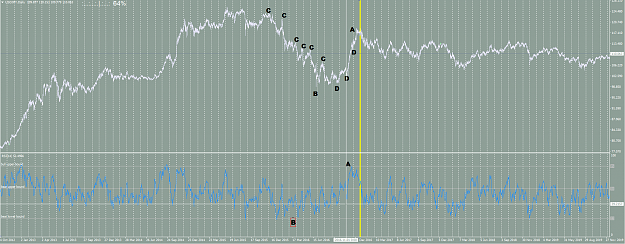
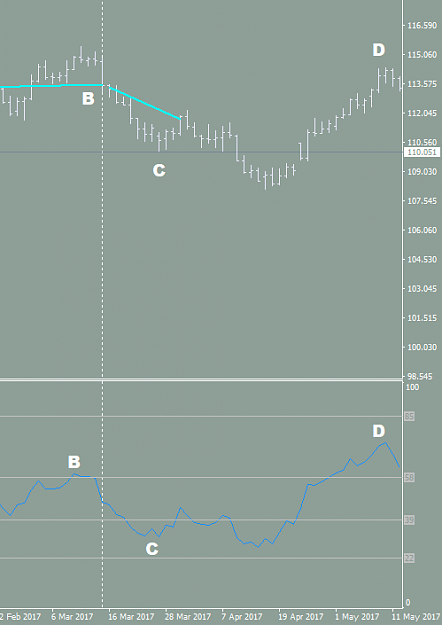
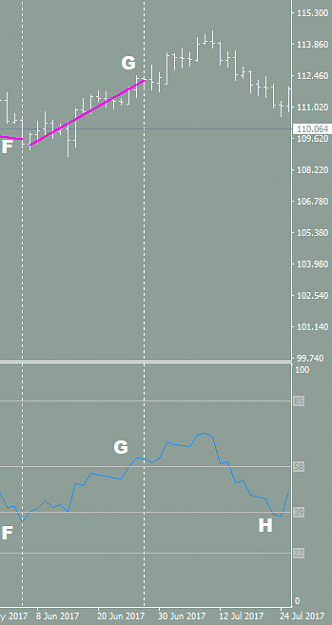
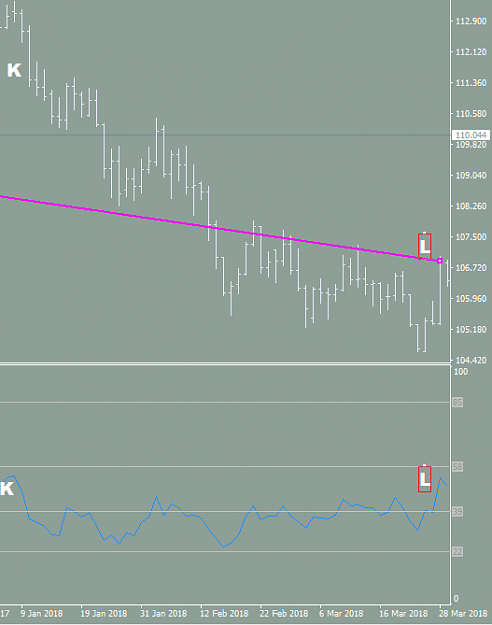
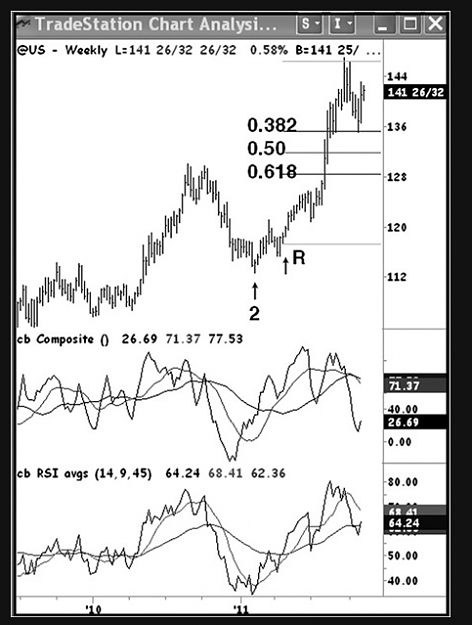
One year view
The big drop took 3 months
Remained at lows for 1.5 months
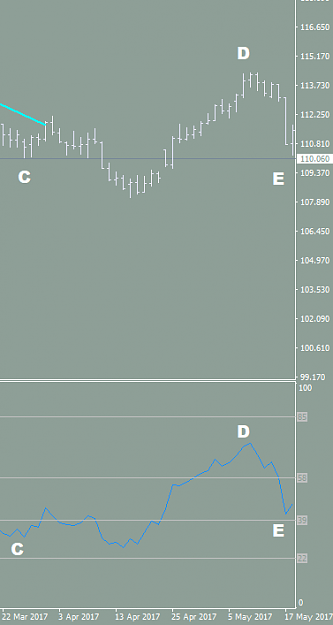
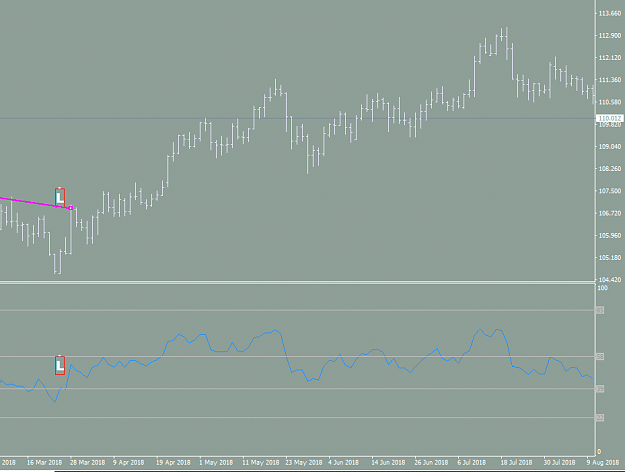
A ‘spectactular spike up (so basically he’s just going to describe four charts - I should delete all this. BAH)
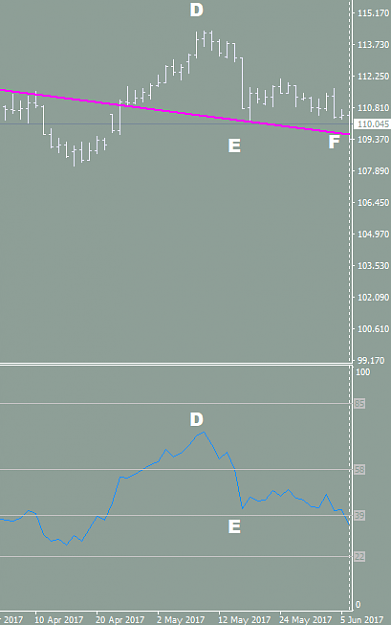
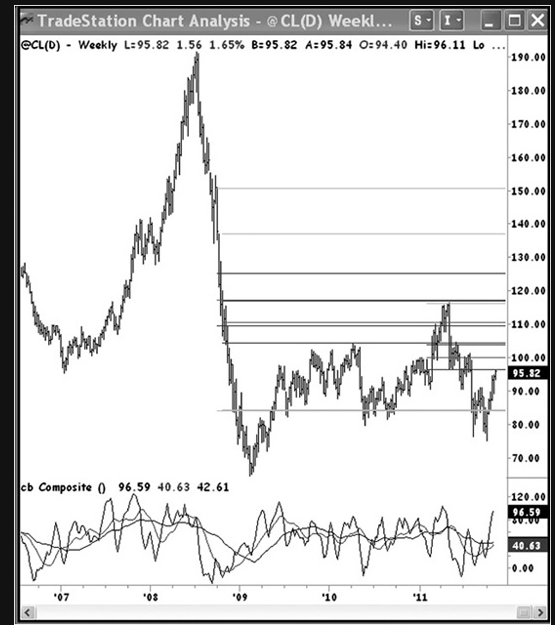
Well there’s the four charts. Maybe it will be helpful when we look at DT’s criteria for an effective grid size.
- Consider % changes in currency values, adjust with volatility
- Leave room for error; no hard and fast rules (he warns against rigid thinking but I wonder if this qualifies as thinking at all)
- Nominal number of pips will vary but DT pulls the number 500-600 pips for EU out of thin air
- For EU or AU (currencies with 1:1 relation) a 100 pip change is 1%
- For 1:1 ranges of about 400 pips ‘work well’ (to do whaaaaaaaaaaat??)
- With GBPUSD at 1.6-1.8 you need 400x 1.6 or 1.8 so 700-800 pips
- EURUSD at higher prices will need more pips ,etc.
- Identify relevant support and resistance
- If the fundamental trend is a certain direction, say UP, then allow for ‘continuous breakouts’ in that direction
- Have a grid adjustment bias to accommodate this - ask if it breaks and makes a new level, where will the first stop be?
- You won’t go too far wrong expanding the upside median grid extreme in increments of ½ the current median grid size
- But also - if there is a counter fundamental trend move (intermediate drivers dominate, while longer term holds true) as a rally fizzles you need to allow for a lower extreme grid adjustment. Basically do whatever.
- There are no hard and fast rules so do whatever
- It is in your hands if you want to try to exploit this expected down shift. Don’t come crying to me, sucker!
Honestly I don’t know if I can continue. Was it all a bunch of BS the whole time?

DT talks a lot more as you probably guessed but it’s just ...nothing.
- When the countertrend reverses, expect choppiness, and ‘adhere to strictly median trading principles’ (never mentioned! Did he mention the median trading principles??)
- Your approach differs at the high or low end of the grid…
- The median grid is a very personal tool (so you know, we can’t complain when it doesn’t work because it’s personal to you, sappo)
Mercifully the chapter eventually ends.