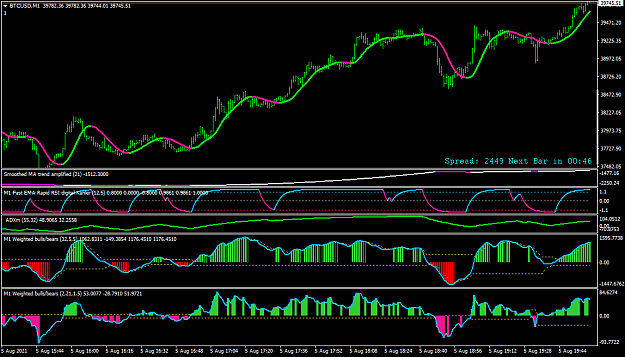
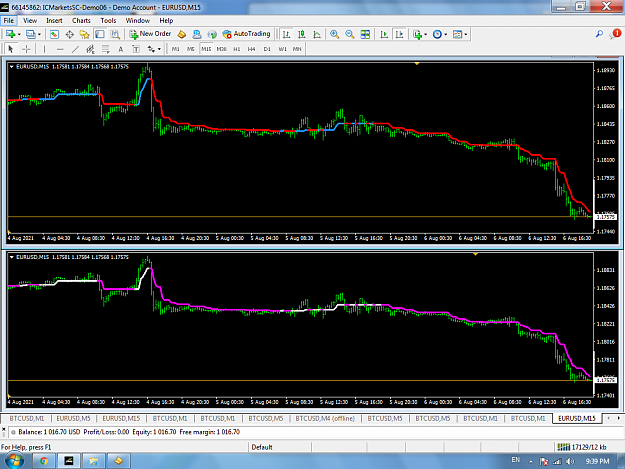
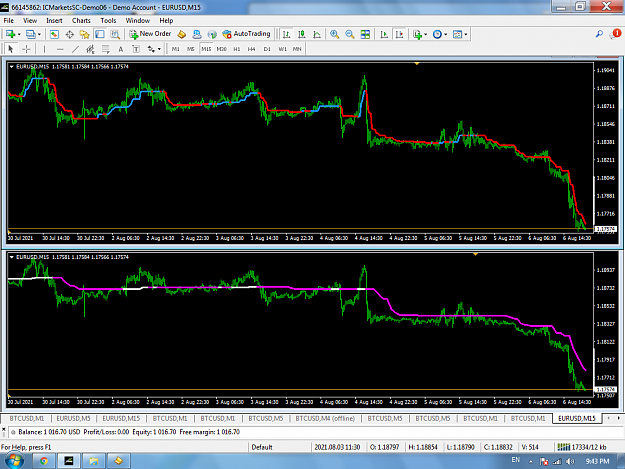
Disliked{quote} I have added M1 to H4 as that is probably all that is needed for day to day trading and added a label to show which calculation is being used. {file} {image}Ignored
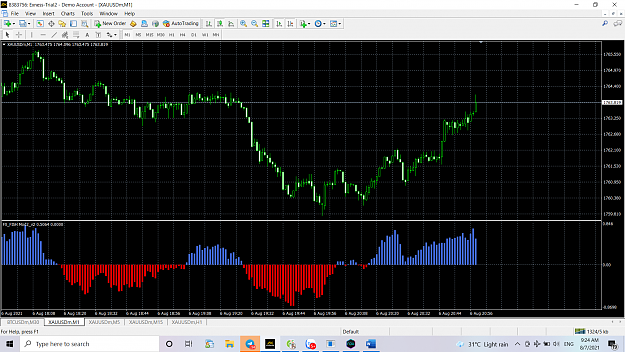
Bull and Bear power : is it based on tick volume?
If not , kindly convert this into a volume indicator based on Volume of Buy, Sell and Delta. It will give an instant snapshot of the buying and selling pressure in a market.
Volume Delta is the difference between buying and selling power. Volume Delta is calculated by taking the difference of the volume that traded at the offer price and the volume that traded at the bid price. If delta is greater than 0 you have more buying than selling pressure. If delta is less than 0, you have more selling than buying pressure.
Volume delta provides a critical edge by helping spot potential large reversals in the market.
Nowadays, MT4 platforms are offering CFDs based on futures, so their tick volumes are reliable. This indicator will be very useful.
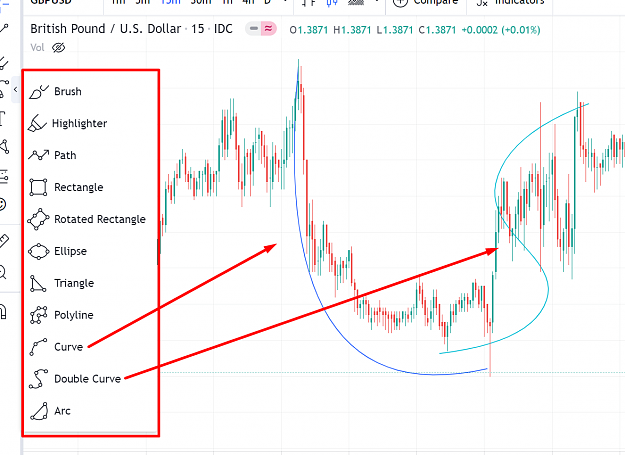
If you have this indicator as part of a cloud-like chart marking the peak of the volume, showing M1 then it will help newcomer traders like retirees and elderly people can trade based only on this SINGLE indicator spotting exhaustion points.
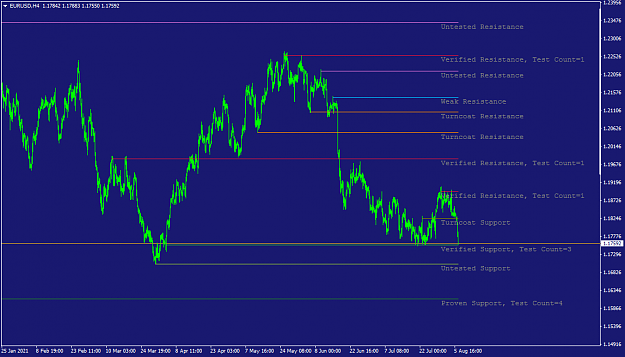
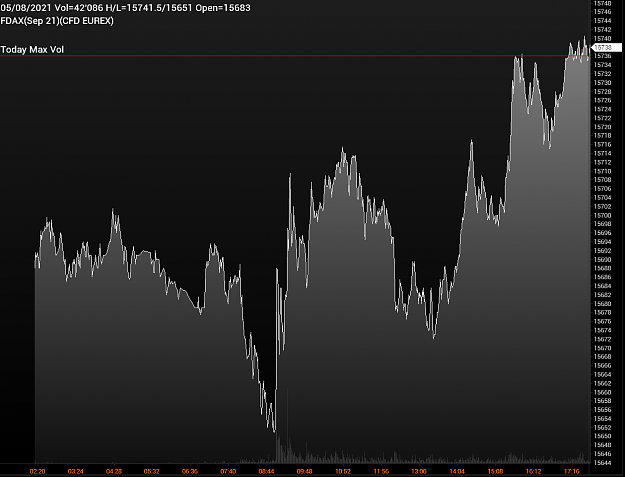
Attached Image (click to enlarge)
Practice makes a person perfect