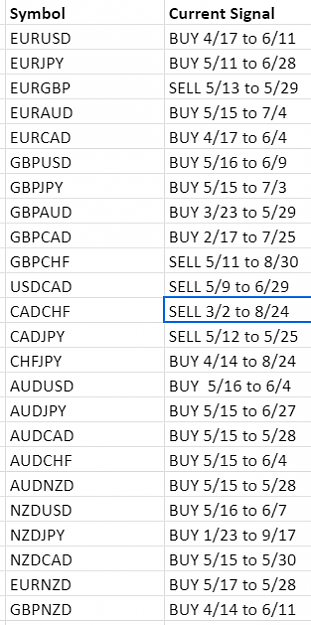
This is experimental trading using Gann Square of 9 at the heart of the system - using significant price movement dates in the past few years (could be from many years depending on when the financial instrument started trading). I have been experimenting by using SQUAREROOT of the financial instrument's age as the number of years that i would go back to identify the dates when major UP or DOWN moves happened in the past.
Price Action is very crucial. Entries and Exits are based on Price Action. Timing is based on Gann Square of 9.
Multi timeframe analysis (Especially on Higher Timeframes like 4 Hour, Daily, Weekly are important)
Look for Fresh and Strong Demand and Supply zones to add more probability to the trade
Strong patterns like M and W (especially with a crack and snap / false break outs) increase the probability of the trade
Excellent money management is required: Be ready to exit the trade when the price does not go in the expected direction - same rules of Price Action analysis apply here.
The charts use 200 EMA (only as a Support / Resistance and nothing else). This system can be traded on any timeframe. I prefer H4 or H1 and sometimes M15 - but depending on my bandwidth, i switch between timeframes for trading (preferably higher time frames only).
Please be polite to others. The goal is to learn, improve and become a better trader.
One approach to trading this system:
Disclaimer: The details shared in this thread are for information only and I am not responsible for your trading losses or gains. Please trade sensibly.
Price Action is very crucial. Entries and Exits are based on Price Action. Timing is based on Gann Square of 9.
Multi timeframe analysis (Especially on Higher Timeframes like 4 Hour, Daily, Weekly are important)
Look for Fresh and Strong Demand and Supply zones to add more probability to the trade
Strong patterns like M and W (especially with a crack and snap / false break outs) increase the probability of the trade
Excellent money management is required: Be ready to exit the trade when the price does not go in the expected direction - same rules of Price Action analysis apply here.
The charts use 200 EMA (only as a Support / Resistance and nothing else). This system can be traded on any timeframe. I prefer H4 or H1 and sometimes M15 - but depending on my bandwidth, i switch between timeframes for trading (preferably higher time frames only).
Please be polite to others. The goal is to learn, improve and become a better trader.
One approach to trading this system:
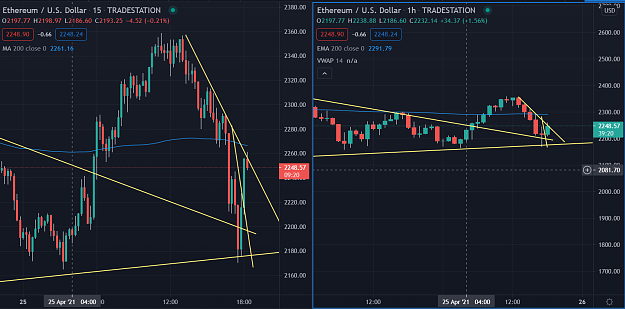
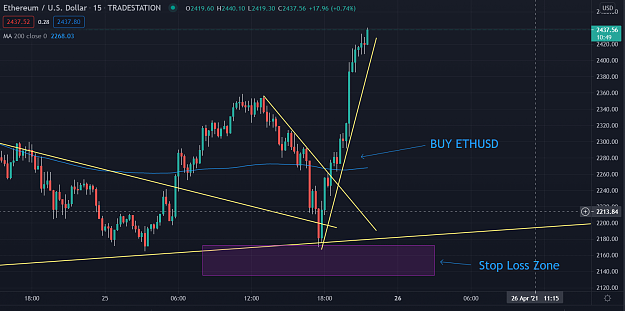
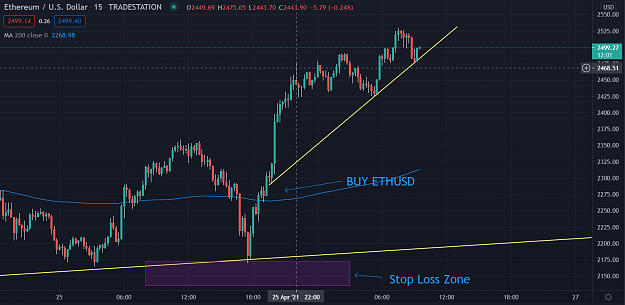
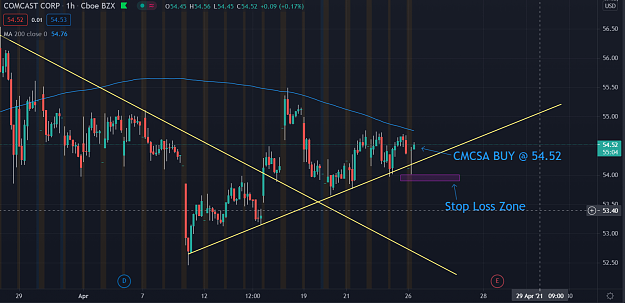
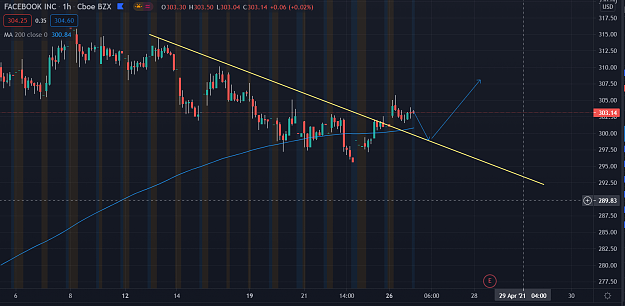
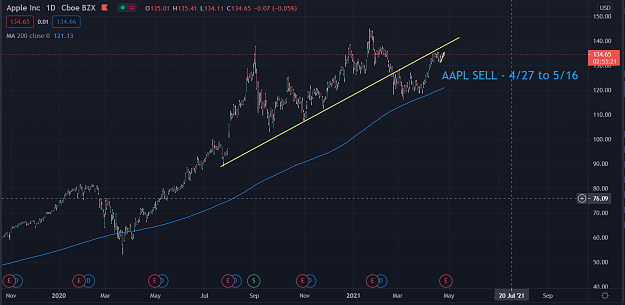
Attached Image (click to enlarge)
Disclaimer: The details shared in this thread are for information only and I am not responsible for your trading losses or gains. Please trade sensibly.
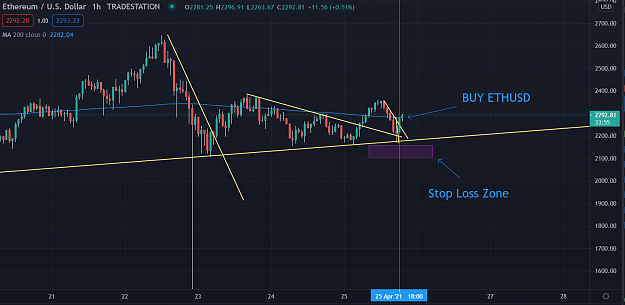
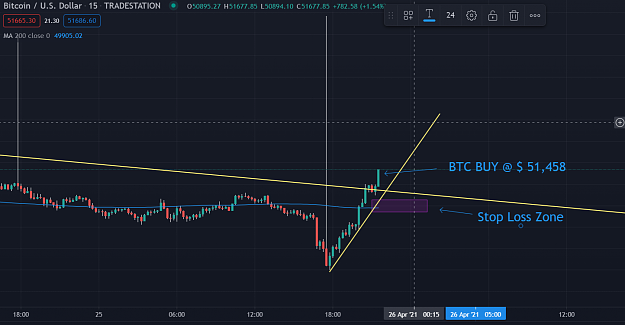
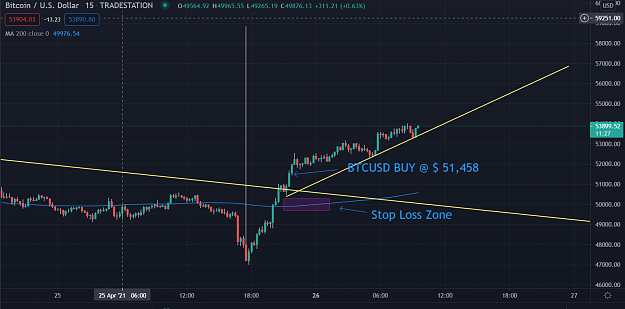
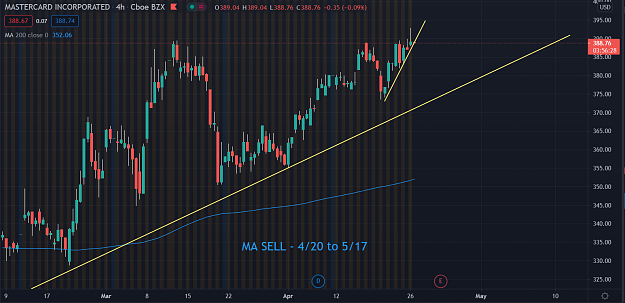
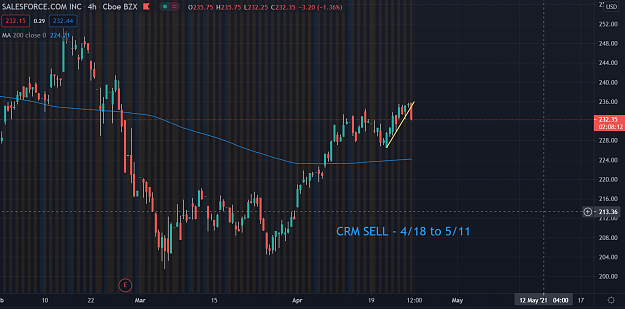
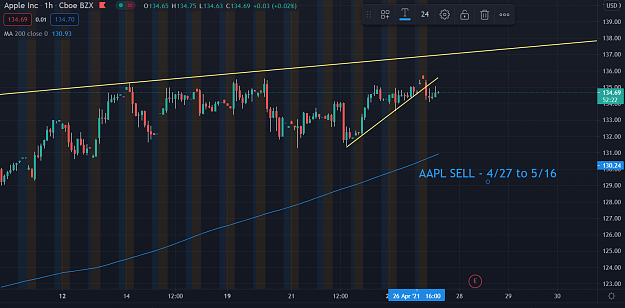
Attached Image (click to enlarge)
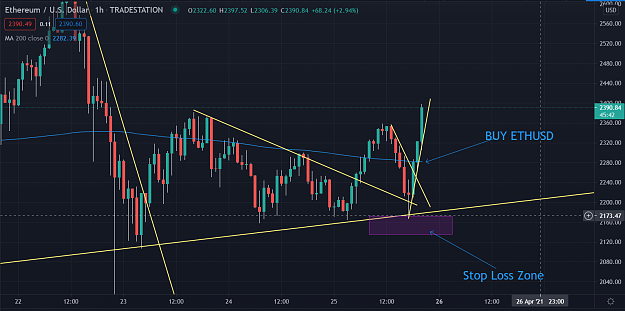
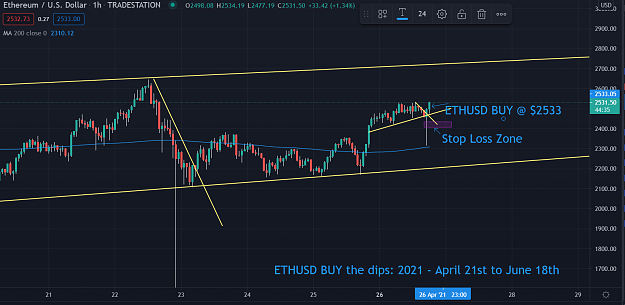
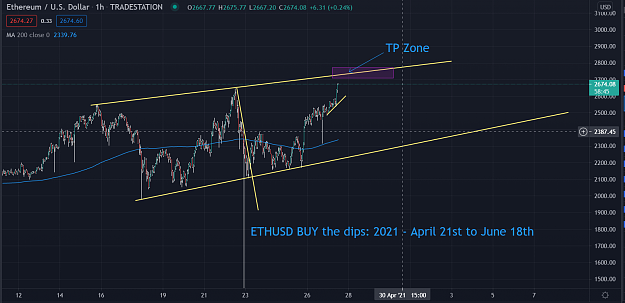
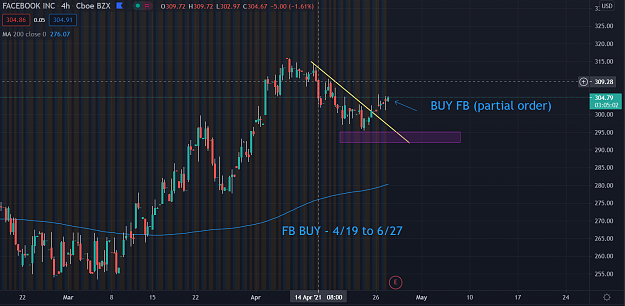
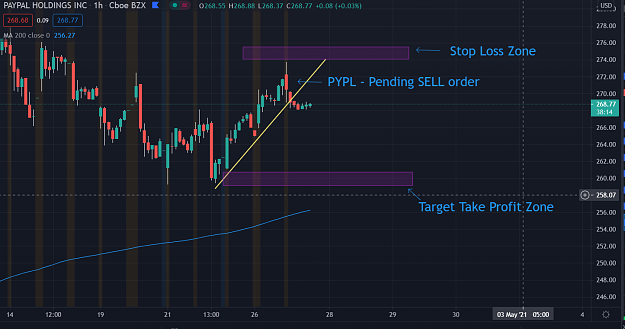
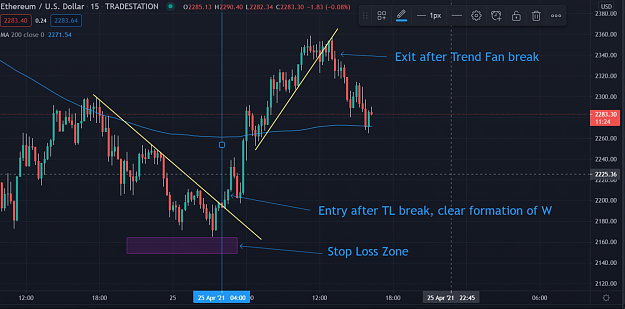
Attached Image