Looking for help in locating indicators whose logic can be used for collecting statistics and analysing it.
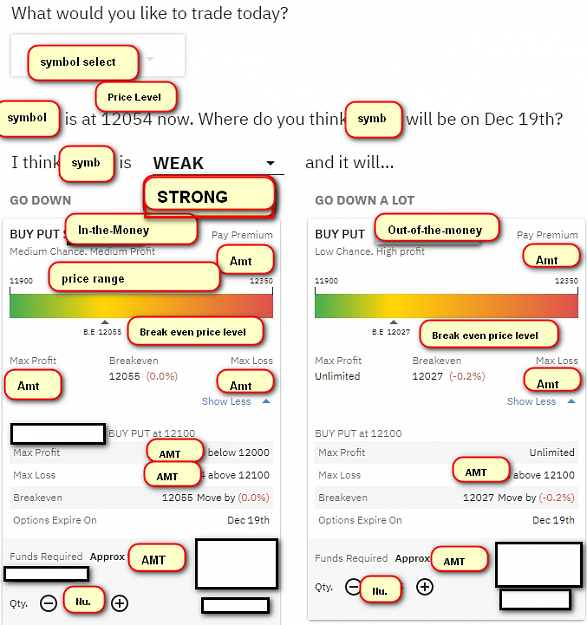
It is a sort of visual Excel backtester where I input hypothetical TP or SL in Pips and hypothetical Open to Close Time in Minutes, price levels being touched by horizontal levels drawn on % percentage and plotted with Minimum and Maximum scale with Pips or % values.
Indicators should not depend on Moving Average or Dynamic values. Values should be constant and of closed candles.
Example: Yesterday High, Low and Mid is good. The value is constant. I can introduce % marked levels instead of Fibo scale or any Pivots.
ADR also falls in same category.
Which other indicators do you think can be used for plotting trades in such a way?
The Excel analysis tool will be for technology-challenged (including Excel newbies) retirees and housewives.
Will also appreciate if links for such a visual tool in Excel are posted .
Thank you in anticipation of your help
Practice makes a person perfect