My heartfelt thanks to all the wonderful folks from whom i had learnt over the years - how to trade and how not to trade.
Prerequisites:
1. A good understanding of the basics of Price Action, Candlesticks, Support and Resistance, Money and Risk management.
2. Patience and a desire to trade without GREED and without FEAR
3. Ability to monitor the charts and take trades between: Open of European markets and close of London markets
Indicators used:
1. 200 EMA (Support and Resistance )
2. VWAP ( Support and Resistance )
3. Volume ( Trade Entry Confirmation )
Direction of the trade is determined by the HTF price action
Preparation steps before trading:
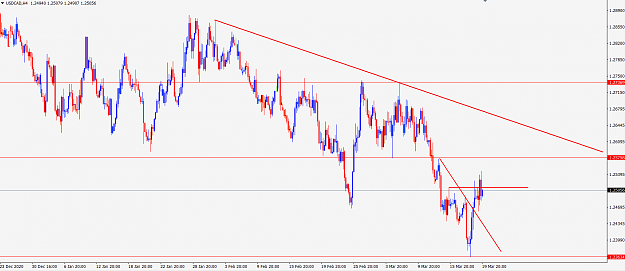
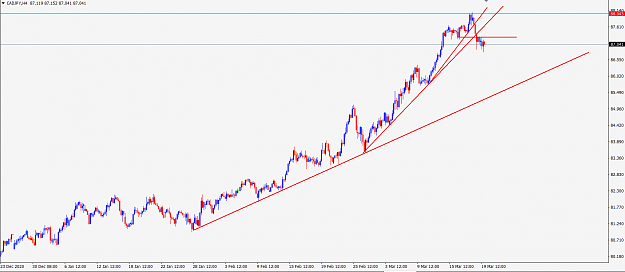
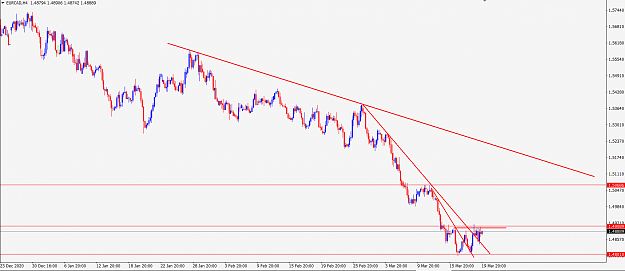
1. Draw horizontal and non-horizontal (trend lines) on higher timeframes (Monthly, Weekly, Daily, 4 Hour)
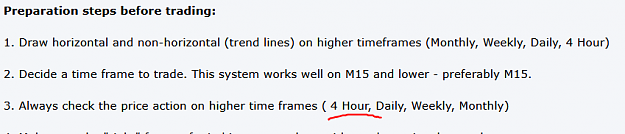
2. Decide a time frame to trade. This system works well on M15 and lower - preferably M15.
3. Always check the price action on ALL higher time frames ( 4 Hour and Daily and Weekly and Monthly)
4. Make sure the "right" frame of mind is present along with good emotional control
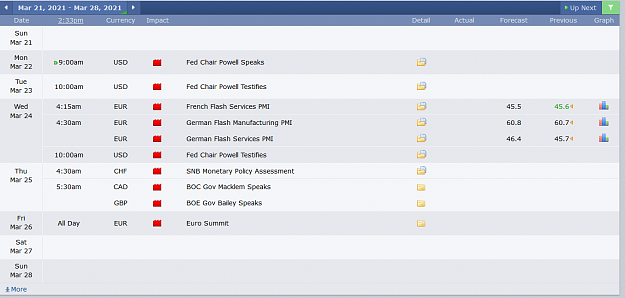
5. Stay out of the market before major news events like FOMC, Interest rate decisions,NFP etc
6. Never chase the price.
7. Trade what you see and not what you think
8. Capital preservation is key to long term success. Do not enter a trade if you do not know how much capital you are risking.
Entry criteria:
1. Good volume must be present (preferably above the 200 EMA of the volume)
2. Good size candles should form (Avoid Extreme candles which are too big or too small .Refer to the "normal" sized candles for that pair in the recent past)
3. Ensure that there is "sufficient" gap to the next PA (in the direction of the trade)
BUY:
1. Price should be above 200 EMA or cross 200 EMA and should have closed reasonably well above a previous price action zone and then retraces back to
either the 200 EMA or VWAP or another previous price action zone or a confluence of one or more of 200 EMA, VWAP or PPA.
2. Wait for rejection from that area on high volume in the upward direction.
3. Entry is after the close of that rejected candle and stop loss is below the candle low
4. Move stop loss to break even after price moves reasonable number of pips (depending on your trading time frame and the volatility of the pair, it could be
anywhere between 25 - 40 pips (on M!5). You could also move the stop loss to break even after price moves the same number of pips as size of the signal candle (high to low)
5. Draw trend lines as the price continues to move in the direction of the trade.
6. Exit once 1:2 or 1:3 Risk to Reward ratio is seen or a major PA zone is reached or the inner most trend fan is broken by the price in the opposite direction.
SELL:
1. Price should be below 200 EMA or cross 200 EMA and should have closed reasonably well below a previous price action zone and then retraces back to
either the 200 EMA or VWAP or another previous price action zone or a confluence of one or more of 200 EMA, VWAP or PPA.
2. Wait for rejection from that area on high volume in the downward direction.
3. Entry is after the close of that rejected candle and stop loss is above the candle high
4. Move stop loss to break even after price moves reasonable number of pips (depending on your trading time frame and the volatility of the pair, it could be
anywhere between 25 - 40 pips (on M!5). You could also move the stop loss to break even after price moves the same number of pips as size of the signal candle (high to low)
5, Draw trend lines as the price continues to move in the direction of the trade.
6. Exit once 1:2 or 1:3 Risk to Reward ratio is seen or a major PA zone is reached or the inner most trend fan is broken by the price in the opposite direction.
Example(s) of how to trade:
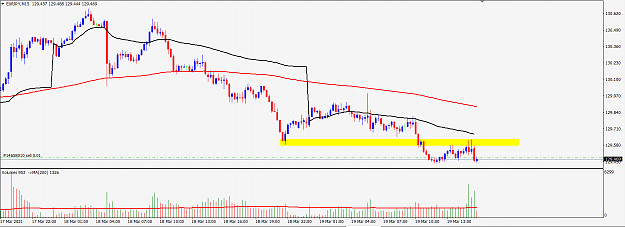
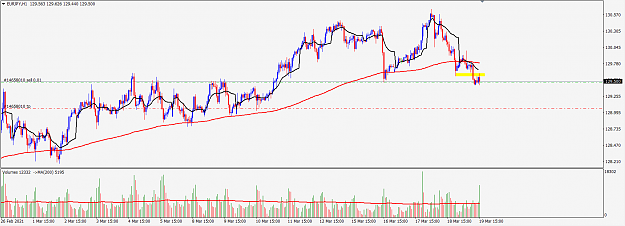
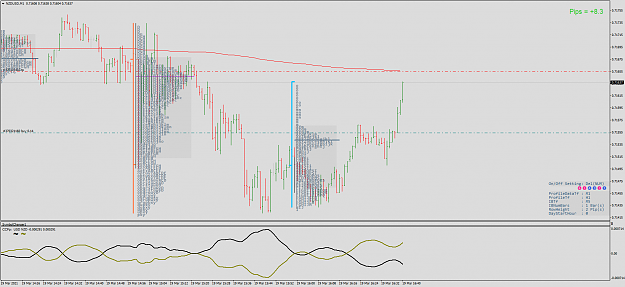
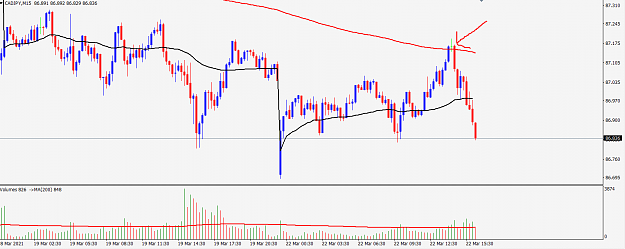
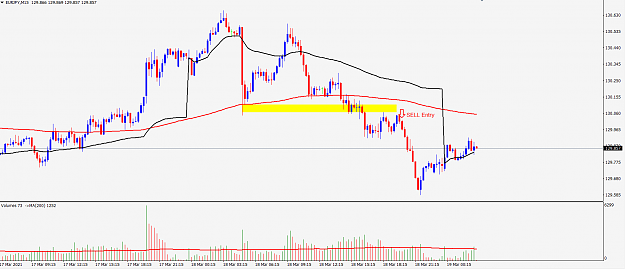
The below SELL entry for EURJPY formed on rejection with lower volume candle. Although this trade worked out, i would avoid this due to below average volume in the area of the trade entry.
High Probability Trade Set Ups:
1. Rejection of price from a confluence of multiple factors (more the better)
a. 200 EMA
b. VWAP
c. HTF trend line
d. Round Number
e. Strong PPA zone
2. Setups identified by using multiple time frame (MTF) analysis
3.Look for Marubozu or similar candles near the rejection area - these indicate dominance of either sellers or buyers. Please observe the price movement on the
charts once these types of candles form - especially in the price rejection area.
SELL: I usually look for a candle formation with no bottom wick (sometimes i am okay with a very tiny bottom wick : < 1 pip) and 95+ % of the candle is body
of the candle.
BUY: I usually look for a candle formation with no top wick ( (sometimes i am okay with a very tiny top wick : < 1 pip)) and 95+ % of the candle is body of
the candle
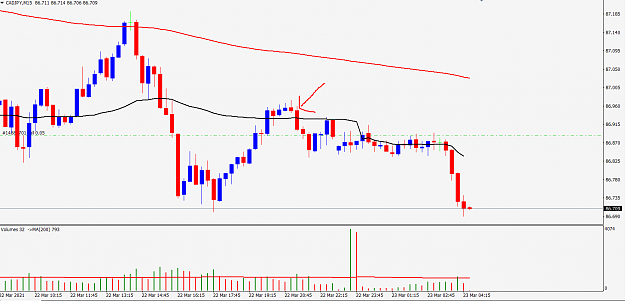
Example of a Marubozu like (not 100%) candle is shown in the chart below: The candle formed when price got rejected from VWAP
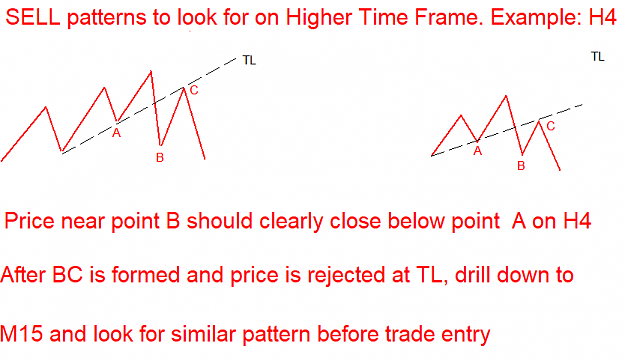
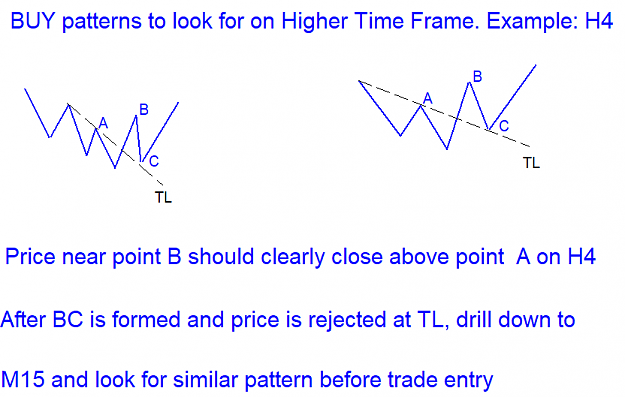
Example of price action patterns to look for when doing analysis on HTF:
Rules for posting on this thread:
1. Please post only using the template and indicator provided or indicator free charts if you have a question / comment regarding price action on HTF.
There are many ways to trade and posting a different system adds to the confusion and we are definitely trying to avoid that here. Thank you for understanding.
Repeat posts that do not adhere to the above rule will be minimized - again there are many great ideas and many great traders but lets stick to the system posted here.
Prerequisites:
1. A good understanding of the basics of Price Action, Candlesticks, Support and Resistance, Money and Risk management.
2. Patience and a desire to trade without GREED and without FEAR
3. Ability to monitor the charts and take trades between: Open of European markets and close of London markets
Indicators used:
1. 200 EMA (Support and Resistance )
2. VWAP ( Support and Resistance )
3. Volume ( Trade Entry Confirmation )
Direction of the trade is determined by the HTF price action
Attached File(s)
Attached File(s)
Preparation steps before trading:
1. Draw horizontal and non-horizontal (trend lines) on higher timeframes (Monthly, Weekly, Daily, 4 Hour)
2. Decide a time frame to trade. This system works well on M15 and lower - preferably M15.
3. Always check the price action on ALL higher time frames ( 4 Hour and Daily and Weekly and Monthly)
4. Make sure the "right" frame of mind is present along with good emotional control
5. Stay out of the market before major news events like FOMC, Interest rate decisions,NFP etc
6. Never chase the price.
7. Trade what you see and not what you think
8. Capital preservation is key to long term success. Do not enter a trade if you do not know how much capital you are risking.
Entry criteria:
1. Good volume must be present (preferably above the 200 EMA of the volume)
2. Good size candles should form (Avoid Extreme candles which are too big or too small .Refer to the "normal" sized candles for that pair in the recent past)
3. Ensure that there is "sufficient" gap to the next PA (in the direction of the trade)
BUY:
1. Price should be above 200 EMA or cross 200 EMA and should have closed reasonably well above a previous price action zone and then retraces back to
either the 200 EMA or VWAP or another previous price action zone or a confluence of one or more of 200 EMA, VWAP or PPA.
2. Wait for rejection from that area on high volume in the upward direction.
3. Entry is after the close of that rejected candle and stop loss is below the candle low
4. Move stop loss to break even after price moves reasonable number of pips (depending on your trading time frame and the volatility of the pair, it could be
anywhere between 25 - 40 pips (on M!5). You could also move the stop loss to break even after price moves the same number of pips as size of the signal candle (high to low)
5. Draw trend lines as the price continues to move in the direction of the trade.
6. Exit once 1:2 or 1:3 Risk to Reward ratio is seen or a major PA zone is reached or the inner most trend fan is broken by the price in the opposite direction.
SELL:
1. Price should be below 200 EMA or cross 200 EMA and should have closed reasonably well below a previous price action zone and then retraces back to
either the 200 EMA or VWAP or another previous price action zone or a confluence of one or more of 200 EMA, VWAP or PPA.
2. Wait for rejection from that area on high volume in the downward direction.
3. Entry is after the close of that rejected candle and stop loss is above the candle high
4. Move stop loss to break even after price moves reasonable number of pips (depending on your trading time frame and the volatility of the pair, it could be
anywhere between 25 - 40 pips (on M!5). You could also move the stop loss to break even after price moves the same number of pips as size of the signal candle (high to low)
5, Draw trend lines as the price continues to move in the direction of the trade.
6. Exit once 1:2 or 1:3 Risk to Reward ratio is seen or a major PA zone is reached or the inner most trend fan is broken by the price in the opposite direction.
Example(s) of how to trade:
Attached Image (click to enlarge)
The below SELL entry for EURJPY formed on rejection with lower volume candle. Although this trade worked out, i would avoid this due to below average volume in the area of the trade entry.
Attached Image (click to enlarge)
High Probability Trade Set Ups:
1. Rejection of price from a confluence of multiple factors (more the better)
a. 200 EMA
b. VWAP
c. HTF trend line
d. Round Number
e. Strong PPA zone
2. Setups identified by using multiple time frame (MTF) analysis
3.Look for Marubozu or similar candles near the rejection area - these indicate dominance of either sellers or buyers. Please observe the price movement on the
charts once these types of candles form - especially in the price rejection area.
SELL: I usually look for a candle formation with no bottom wick (sometimes i am okay with a very tiny bottom wick : < 1 pip) and 95+ % of the candle is body
of the candle.
BUY: I usually look for a candle formation with no top wick ( (sometimes i am okay with a very tiny top wick : < 1 pip)) and 95+ % of the candle is body of
the candle
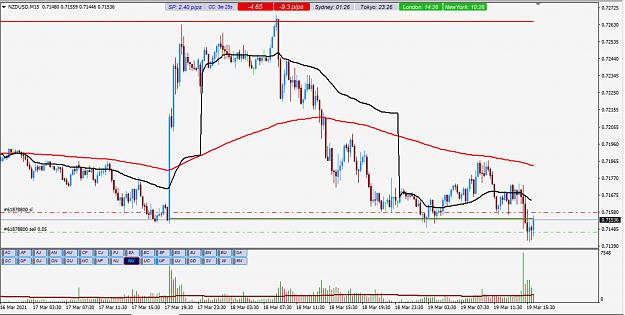
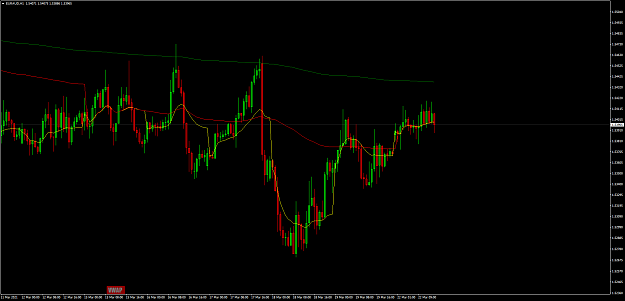
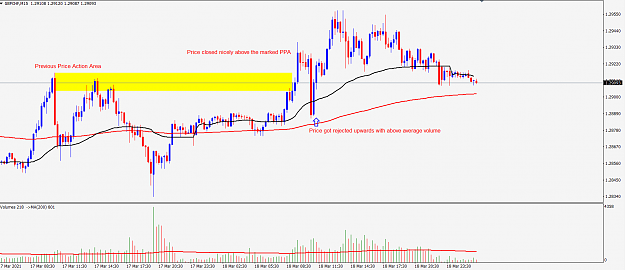
Example of a Marubozu like (not 100%) candle is shown in the chart below: The candle formed when price got rejected from VWAP
Attached Image (click to enlarge)
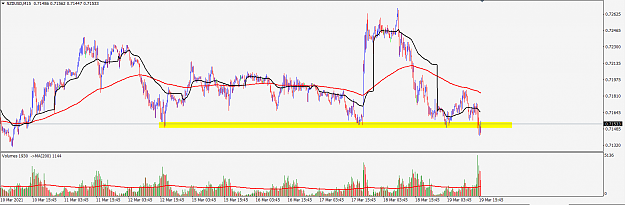
Example of price action patterns to look for when doing analysis on HTF:
Attached Image (click to enlarge)
Attached Image (click to enlarge)
Rules for posting on this thread:
1. Please post only using the template and indicator provided or indicator free charts if you have a question / comment regarding price action on HTF.
There are many ways to trade and posting a different system adds to the confusion and we are definitely trying to avoid that here. Thank you for understanding.
Repeat posts that do not adhere to the above rule will be minimized - again there are many great ideas and many great traders but lets stick to the system posted here.