Hey Traders,
I'm excited to release my FIRST EVER TradingView Indicator.
The OGT Trend Dashboard has coded in Pine and released for TradingView.
Checkout the tutorial video below for all the details.
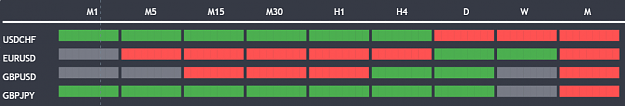
The One Glance Trader (OGT) Trend Dashboard is a trend indicator that visualises if a stock, currency pair etc. is trending (up/down) on multiple time frames. The aim of the dashboard is to provide a "one glance" view for a custom list of symbols to show a clear trend bias. A green timeframe signals it is in a up trend, red for a down trend and grey for no clear trend direction. The indicator uses 3 EMAs (fast, medium slow) to define whether a symbol is trending or ranging. The 3 EMAs periods can be defined by the user.
Indicator Settings
- Fast, medium and slow EMA periods
- Symbols (up to 4 can be selected). First symbol will always be the chart the indicator is applied to
- Alerts - select for all symbols you want alerts so (historic alerts for the first symbol will be visually applied on the chart)
- Timeframes ( M1 to Monthly)
Alerts - You can create alerts for any of the 4 pairs when all timeframes selected are trending up (green) or down (red).
How To Use the OGT Trend Dashboard
- Entry Signal For Trends: When all desired timeframes are either trending up/down enter the market in the direction of the trend
- Determine Trend Bias: Use the dashboard to complement existing trend trading systems as added confirmation
The OGT Trend Dashboard MT4 / MT5 download thread can be found below:
MT4 Thread - https://www.forexfactory.com/thread/...oard-indicator?
MT5 Thread - https://www.forexfactory.com/thread/...icator-release?
Thanks,
Zoheb.
I'm excited to release my FIRST EVER TradingView Indicator.
The OGT Trend Dashboard has coded in Pine and released for TradingView.
Checkout the tutorial video below for all the details.
Inserted Video
The One Glance Trader (OGT) Trend Dashboard is a trend indicator that visualises if a stock, currency pair etc. is trending (up/down) on multiple time frames. The aim of the dashboard is to provide a "one glance" view for a custom list of symbols to show a clear trend bias. A green timeframe signals it is in a up trend, red for a down trend and grey for no clear trend direction. The indicator uses 3 EMAs (fast, medium slow) to define whether a symbol is trending or ranging. The 3 EMAs periods can be defined by the user.
Attached Image (click to enlarge)
Indicator Settings
- Fast, medium and slow EMA periods
- Symbols (up to 4 can be selected). First symbol will always be the chart the indicator is applied to
- Alerts - select for all symbols you want alerts so (historic alerts for the first symbol will be visually applied on the chart)
- Timeframes ( M1 to Monthly)
Alerts - You can create alerts for any of the 4 pairs when all timeframes selected are trending up (green) or down (red).
How To Use the OGT Trend Dashboard
- Entry Signal For Trends: When all desired timeframes are either trending up/down enter the market in the direction of the trend
- Determine Trend Bias: Use the dashboard to complement existing trend trading systems as added confirmation
The OGT Trend Dashboard MT4 / MT5 download thread can be found below:
MT4 Thread - https://www.forexfactory.com/thread/...oard-indicator?
MT5 Thread - https://www.forexfactory.com/thread/...icator-release?
Thanks,
Zoheb.
Never stop investing. Never stop improving. Never stop doing something new