Hello all, I wanted to start a discussion on the trading system that I have been working on developing. I want this to be a place with free flowing ideas and friendly discussion. For full transparency, I want to make it known upfront that my work is based on the work of the very infamous JetTrader / 7thSignalTrader / SignalBender……etc. I am not him. I ran across his work in 2005 and I realized pretty quickly that the guy is a whack job (he proved it in March, many of you know the story), but I was attracted to his work and saw the potential. I worked to get as much information on the base indicators he used and the method of trading system development. From there, I have developed my own indicators and filters.
I have worked off and on over the past 15 years to create what I hope to eventually be a great, consistent and profitable trading system. As it stands right now, it can be scary accurate for days or weeks, and then fall down and have a losing streak.
I am not making any claims as to the accuracy or money making ability of the system. I can say that I see the potential of this being a high accuracy system. As it is fully quantitative, there are limitless calculations that can be added that I’m probably not thinking of to further model market activity.
This is strictly a quantitative system and is done in Excel. There will be no charts or EA’s.
Let’s get into the meat of the system and the base indicators. I’m not going to take the time to rename everything, so I’ll use the language of the original creator for these indicators. Besides, if any of you are vaguely familiar with his work, this will make it easier to follow.
The very basis of the system relies on numerical inputs, known as ‘Deltas’ which are differences between prices points.
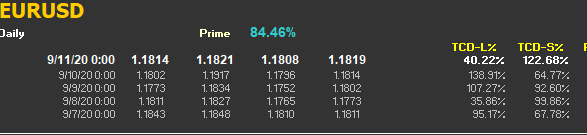
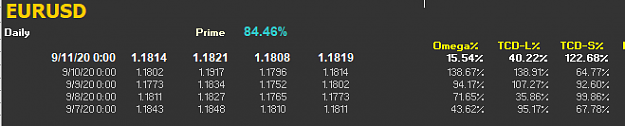
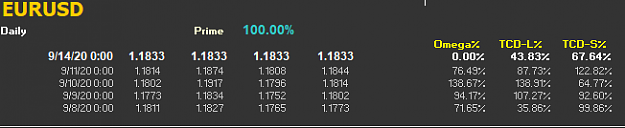
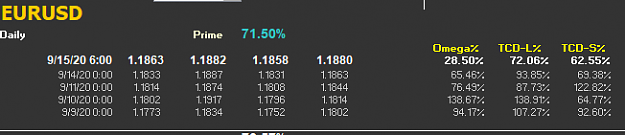
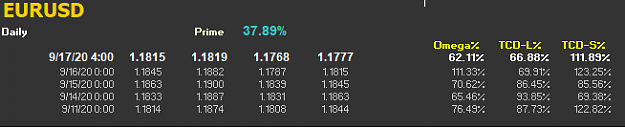
The most important of these deltas are TCD’s which are a calculation of price points between the current day and previous day. These calculations are then fed into an exponential weighted moving average. The current performance of these indicators are then weighed against the EWMA to get an idea of what may occur. For example, let’s say the ‘delta’ of the high minus the previous day’s low has an EWMA of 100 pips. As the session opens (this can be any session open) the current calculation of the current high minus yesterday’s low stands at 25 pips. In this case, the TCD ‘fill’ is 25%. As a general rule, the fill percent ‘wants’ to be 100%, which would mean it is acting according to the EWMA. So, in this case, in very simple terms, there is a ‘tendency’ for this Long TCD to complete its fill to 100%, so we might expect the price to go up.
However, there is also a short side TCD which has its own agenda. The short TCD is an inverse of the long: the absolute value of current low – previous day high (or can this can be phrased as yesterday’s high – today’s low)
In a perfect ranging market, these numbers would both be close to 100% day after day, but this rarely happens. There could days on end where the Long side is hitting over 130% and the low is down, say around 65%. This would indicate that the price is trending sharply upwards and adjustments then have to be made. To add to the confusion, the EWMA will now begin adjusting to these high numbers, so the big overfills will get smaller as time goes on. It’s for this and other reasons, that there are many secondary indicators and filters which run alongside these basic TCD’s.
This is the basic framework of the system. I'll go further in future posts if there's any interest. I will try to post up some images later to help describe what I'm talking about.
SB
I have worked off and on over the past 15 years to create what I hope to eventually be a great, consistent and profitable trading system. As it stands right now, it can be scary accurate for days or weeks, and then fall down and have a losing streak.
I am not making any claims as to the accuracy or money making ability of the system. I can say that I see the potential of this being a high accuracy system. As it is fully quantitative, there are limitless calculations that can be added that I’m probably not thinking of to further model market activity.
This is strictly a quantitative system and is done in Excel. There will be no charts or EA’s.
Let’s get into the meat of the system and the base indicators. I’m not going to take the time to rename everything, so I’ll use the language of the original creator for these indicators. Besides, if any of you are vaguely familiar with his work, this will make it easier to follow.
The very basis of the system relies on numerical inputs, known as ‘Deltas’ which are differences between prices points.
The most important of these deltas are TCD’s which are a calculation of price points between the current day and previous day. These calculations are then fed into an exponential weighted moving average. The current performance of these indicators are then weighed against the EWMA to get an idea of what may occur. For example, let’s say the ‘delta’ of the high minus the previous day’s low has an EWMA of 100 pips. As the session opens (this can be any session open) the current calculation of the current high minus yesterday’s low stands at 25 pips. In this case, the TCD ‘fill’ is 25%. As a general rule, the fill percent ‘wants’ to be 100%, which would mean it is acting according to the EWMA. So, in this case, in very simple terms, there is a ‘tendency’ for this Long TCD to complete its fill to 100%, so we might expect the price to go up.
However, there is also a short side TCD which has its own agenda. The short TCD is an inverse of the long: the absolute value of current low – previous day high (or can this can be phrased as yesterday’s high – today’s low)
In a perfect ranging market, these numbers would both be close to 100% day after day, but this rarely happens. There could days on end where the Long side is hitting over 130% and the low is down, say around 65%. This would indicate that the price is trending sharply upwards and adjustments then have to be made. To add to the confusion, the EWMA will now begin adjusting to these high numbers, so the big overfills will get smaller as time goes on. It’s for this and other reasons, that there are many secondary indicators and filters which run alongside these basic TCD’s.
This is the basic framework of the system. I'll go further in future posts if there's any interest. I will try to post up some images later to help describe what I'm talking about.
SB